Choosing an Analytics Layer When Your Entire Stack Is Already Supabase
Separate analytics from production, and give agents governed metrics.
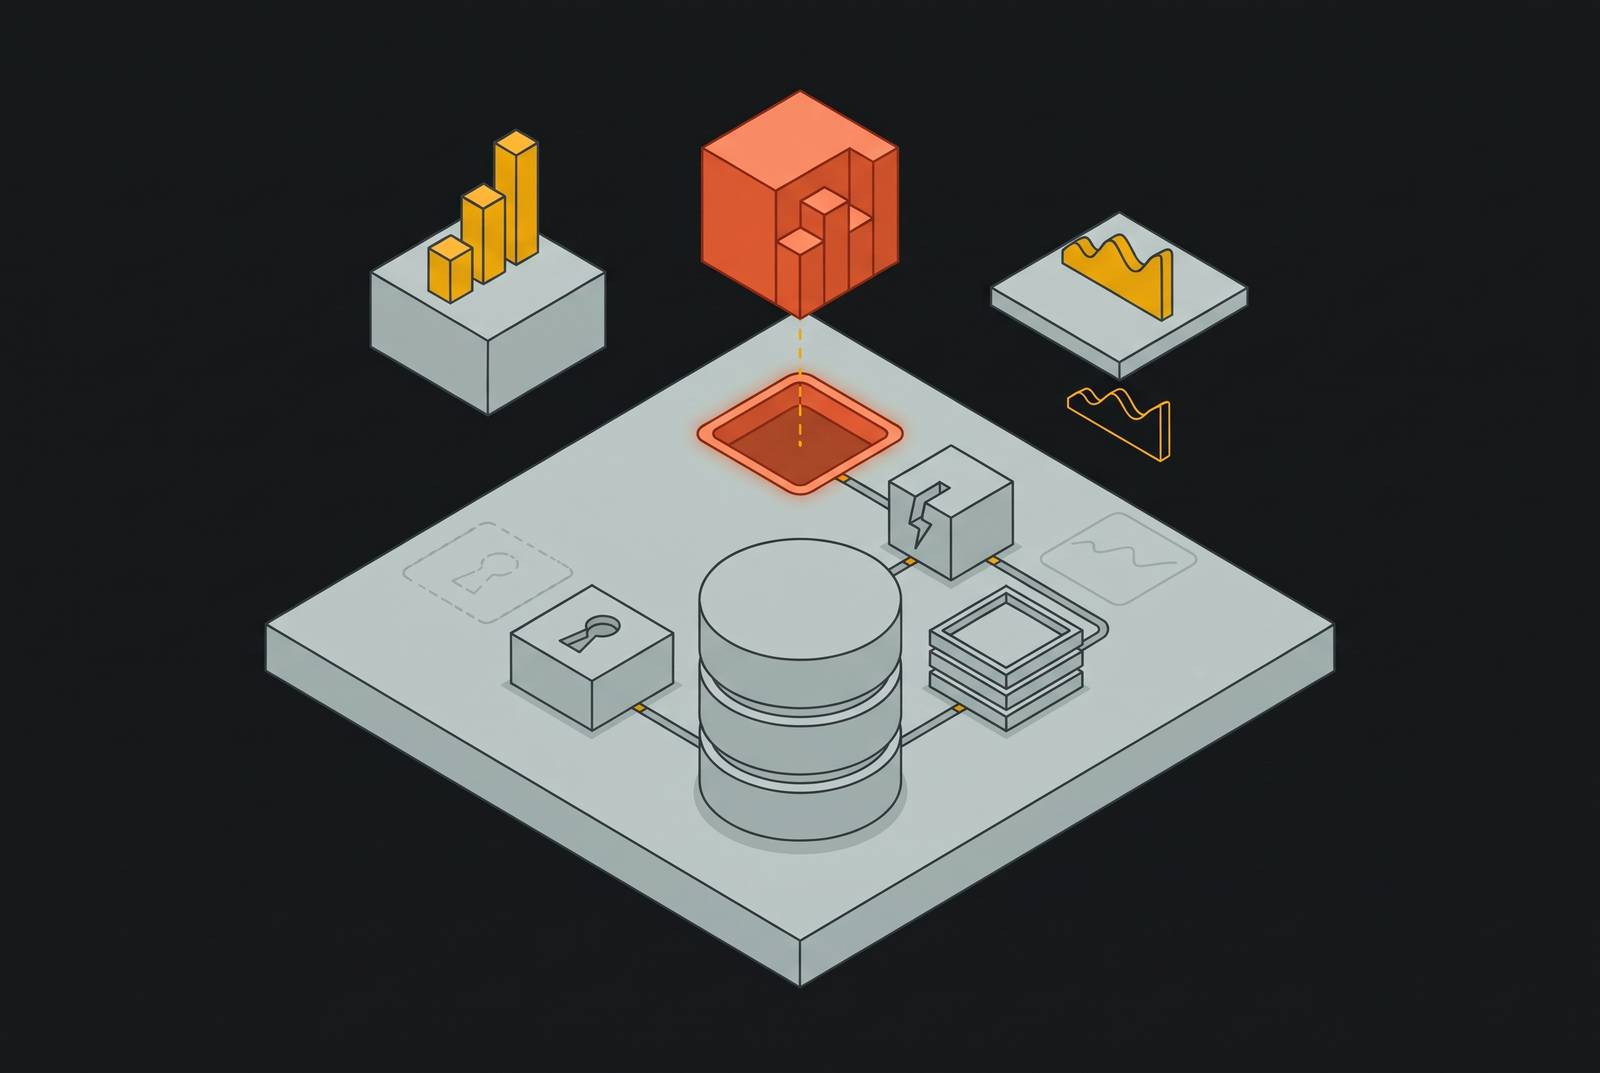
Analytics for Supabase teams should separate analytical queries from production Postgres, avoid team-managed ETL, and give humans and AI agents access to the same governed metrics. Choosing an analytics layer when the entire stack is already Supabase therefore depends on fit. A governed columnar layer meets those needs more fully than a dashboard tool that connects straight to production.
Why analytics on production Postgres breaks in predictable ways for Supabase teams
Postgres is row-oriented and tuned for transactional work, while analytical queries scan and aggregate large swaths of rows. Those scans compete with live application traffic for CPU and memory when they run on the primary database. The workloads need different shapes of compute. A dashboard can therefore degrade application performance even when its queries are valid.
The connection path adds another constraint. Supavisor’s transaction mode is built for short-lived connections and does not support prepared statements, which BI tools often use. Session mode or a direct connection works, but direct connections require IPv6 unless the IPv4 add-on is purchased. Either way, the dashboard holds long-lived connections against the database serving the application.
Per-user row-level security, or RLS, is a poor fit for a BI service account that needs broad scans, so teams must manage a bypass exception or add production policies just for analytics. JSONB introduces ambiguity when five people write five slightly different extraction queries. The extra compute goes to the BI tool instead of users, while a read replica roughly doubles what the team spends on the database and still offers only single-source, row-oriented analytics without cross-source answers.
What Supabase itself signals about where analytics belongs
Supabase’s product architecture distinguishes operational telemetry from analytical storage and business reporting. Logs and Analytics uses Logflare for debugging, while Analytics Buckets provides Iceberg-backed columnar storage with a bring-your-own-engine model. Business dashboards and metrics are not built in. Analytics Buckets puts analytical data in object storage to meet the need for columnar storage.
Supabase’s Open Warehouse Architecture work reinforces that distinction. Hydra joined Supabase after co-developing pg_duckdb, a permissively licensed extension that accelerates analytical queries on Postgres. The stated direction includes tighter integration between Postgres and object storage, serverless analytics workflows, and open table formats. The warehouse architecture and pg_duckdb integration remain an architectural direction under development and are not yet generally available.
Supabase’s self-hosting documentation makes the workload boundary explicit. Logflare defaults to a Postgres backend, but the documentation says that backend is not yet optimized for high insert volumes or heavy queries and recommends BigQuery for production self-hosting. It also advises against sharing one Postgres instance between production workloads and observability data. The June 2026 breaking changes moved Analytics and Vector into a separate overlay. Log aggregation is thus optional infrastructure.
The four criteria that actually matter when evaluating an analytics layer for a Supabase-native stack
The first criterion is no ETL overhead and no new infrastructure for the team to manage. Replication or modeling into Parquet, Iceberg, or DuckDB should allow application data to join Stripe, CRM, and advertising data without requiring a full warehouse build. The second criterion is no production query interference. Separation must happen at the data layer. A different connection mode does not move analytical work off the transactional instance.
The third criterion is safe access for humans and AI agents through a controlled interface to a governed analytical copy. This includes security, query accountability, and protection from production contention. The fourth is metrics the team can still trust as it grows. A semantic layer should define calculations once so that dashboards, team members, and agents resolve revenue or churn against the same meaning.
Why metric drift is a founding-stage problem, not a scaling problem
Metric drift begins when the first competing definitions appear. One engineer writes SUM(revenue), another writes SUM(amount_captured), and the team has two answers for Q2 revenue. Both queries may execute without an error. The disagreement concerns meaning. It can go unnoticed until an investor asks for audited numbers.
That failure gets harder to fix when sales, finance, and product each use their own ARR calculation. Executives then argue about numbers, diverting attention from decisions. A data dictionary gives each metric one owner and one definition, while a semantic layer centralizes calculations such as MRR and LTV. Changes then propagate to dashboards and agent queries. Every metric on the CEO dashboard should reconcile to that shared source.
For founding teams, this does not require measuring everything. Early teams should focus on pull through retention, activation, and what users say, while later teams add efficiency measures such as payback, NRR, and margin. A short set of metrics with clear definitions keeps the list from sprawling. The order of implementation is equally important. A visualization layer over ambiguously named tables can make disputed definitions look authoritative, so the semantic layer needs to precede the charts.
Why AI agents make the production-query problem urgent rather than theoretical
Agents turn the production-query decision into a security and data-integrity decision as well as a performance choice. With direct write access, a logic bug, unexpected input, or prompt injection can corrupt production data. Read access avoids that particular consequence but does not resolve query interference or ambiguous metrics. Access scope changes the risk while governance remains necessary. Teams must choose whether an agent touches production or a controlled analytical copy.
Traditional role-based access control can be inadequate when agents operate dynamically and need temporary permissions. The emerging practice treats each agent as an identity with an owner, stated purpose, allowed connectors, and least-agency access. For a Supabase team deploying agents, the recommended preparation is to inventory their data sources and define row- and column-level policies before connecting them. Every query should also be auditable. A governed interface then lets agents find datasets and ask for them by name without sending analytical queries to production.
Shared definitions improve accuracy as well as control. An agent resolving a request against modeled metrics does not have to infer business meaning from raw column names. A governed MCP interface can also give agents that use different LLMs one access-controlled path to the data. This reduces connector proliferation from N×M to N+M. That simplification is useful, but the interface alone does not establish trustworthy definitions.
How the Model Context Protocol changes the access pattern — and what it still doesn't solve
Anthropic introduced the Model Context Protocol in November 2024 and donated it to the Agentic AI Foundation under the Linux Foundation in December 2025. MCP is an open application-layer standard through which agents connect to data sources using a uniform interface, leaving the meaning of data unspecified. For builders, its practical value is a common route to datasets rather than a separate connector for each agent-source pairing.
The 2026-07-28 specification made MCP stateless at the protocol layer. A remote server that previously needed sticky sessions and a shared session store can run behind a plain round-robin load balancer. That simplifies operations for concurrent agent traffic. It does not establish permissions or metric definitions.
The semantic layer supplies the context MCP cannot provide, including metrics, entities, relationships, and governance policies. Without it, a server over ambiguously named tables leaves agents improvising business definitions. Governed Parquet datasets queryable through DuckDB instead provide pre-calculated context without production connection-pool pressure. Agents find and ask for those datasets through Resources and Tools.
How do you get analytics and dashboards for your Supabase project, and where do current options land?
Connecting BI straight to production Postgres is a quick way to get charts without first building a data pipeline. That convenience is narrower than the first criterion. Cross-source analysis remains unresolved, and analytical queries compete with application traffic. The connection itself supplies neither agent governance nor shared metric definitions. The RLS, pooler, and JSONB constraints also remain. Direct connectivity is therefore not equivalent to a complete analytics layer.
For self-hosted deployments, pg_duckdb accelerates analytical queries by embedding DuckDB’s columnar-vectorized engine inside Postgres. The project’s benchmarks report analytical queries running up to 1000x faster than standard PostgreSQL in some cases, with more typical improvements ahead of well-indexed PostgreSQL on tables with millions of rows. It avoids exporting data or managing a separate system. An embedded engine leaves teams without a separated analytical copy, a semantic-layer, agent-governance, or integration with Stripe and CRM, while limits on which extensions can be installed keep it out of managed Supabase Cloud projects.
Astrato announced its Supabase integration in February 2026, positioning it as BI without ETL, data copies, or additional analytics infrastructure. It supports customer-facing dashboards, internal reporting, and operational data apps with writeback. Its no-ETL claim fits analysis confined to Supabase data. Cross-source joins may still require a data pipeline. Because queries run against Supabase/Postgres, the integration does not itself provide workload separation, and it does not address governed agent access or establish the shared semantic layer required by the framework.
A governed columnar layer with an MCP server takes a different approach. In this pattern, a partner pre-models data into governed Parquet datasets queryable through DuckDB, with no ETL pipeline for the team to manage, no schema changes, and no new production infrastructure. Analytical queries reach the copy, keeping them off production. The semantic layer serves shared definitions to humans and agents, while the controlled interface governs agent access. This satisfies all four criteria when implemented as described, but the partner-managed approach is a poorer fit for a mature data team that wants full ownership of every pipeline layer.
The observability gap that appears before the analytics decision even gets made
A team cannot assess production interference if it cannot see database behavior. Connection count, query latency at p50 and p95, and error rate show how the system is running, while revenue and retention show how the business is doing. Logflare provides operational telemetry. Neither layer substitutes for the other. Without telemetry, a dashboard query can degrade application performance without the team recognizing the cause.
The June 2026 overlay change makes this prerequisite explicit for self-hosted teams. Running Docker Compose without the Analytics overlay removes the Logs UI in Studio, so affected production deployments need external observability or must opt the overlay back in. Many deployments already use external log management. The self-hosting guidance also keeps observability data off the production Postgres instance. With that separation and visibility in place, teams can assess the production cost of their analytics choice rather than treating workload isolation as an abstract preference.
Why early Supabase teams should treat analytics infrastructure as a founding decision, not a later upgrade
Early teams usually lack the data engineering capacity needed for the usual approach of a warehouse, dbt, and a dedicated hire. A columnar layer run by a partner gives founders governed, multi-source analytics without a stack they have to run. Teams that need complete pipeline control may choose differently, but that preference should not be imposed on builders who need trustworthy answers before they have a data department.
At this stage, automated metric centralization is more valuable than visual polish. Numbers with clear definitions sent to an inbox, Slack, or a dashboard help teams make decisions more than good-looking charts based on calculations they disagree on. The same definitions can serve agents as their use expands. That continuity is the durable asset. Governed ARR, churn, active-user, and LTV definitions can survive team changes, investor audits, and agent upgrades.
The selection decision therefore belongs with the founding architecture. Its consequences extend beyond which dashboard is easiest to build today to which questions the team can answer safely tomorrow. The team needs an approach that gives it and its agents one governed data layer they can trust as they scale.