Embedding Agent-Native Usage Tracking Directly Into Supabase Postgres Without a Dashboard Dependency
Triggers and summary tables keep agent usage metrics off live tables.
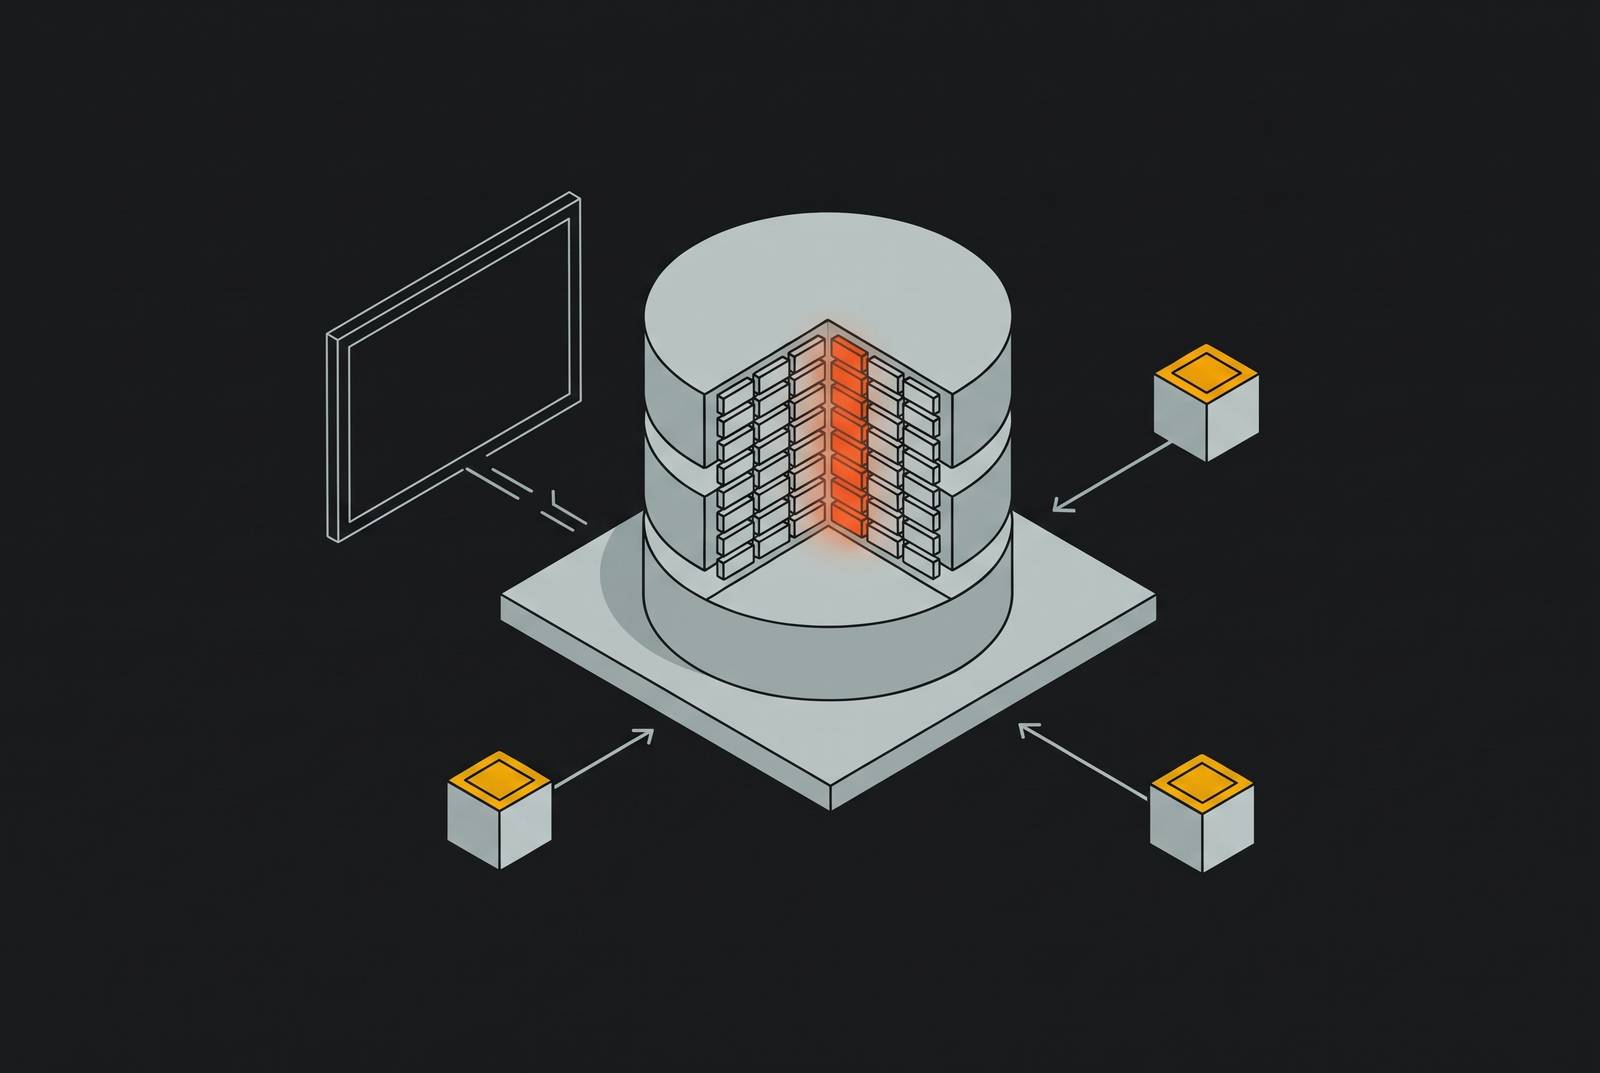
Analytics for Supabase teams should use triggers, functions, and pre-modeled summary tables to capture usage inside Postgres, rather than rely on dashboards that keep polling production tables. Agents make this an infrastructure requirement because they query at machine speed and volume. A governed semantic layer can then serve those summaries to dashboards and agents through the same metric definitions, without giving either consumer unrestricted access to live application data.
Why agents break the assumption that a human is asking the question
Agents change the database’s primary consumer from a person asking a question to a machine pursuing a goal. Traditional backends were designed around predictable, sequential, human-triggered events, while agent workloads are recursive and asynchronous. A single goal can generate thousands of database queries in seconds. The resulting load has a different shape. What used to be peak activity can become normal when agents keep branching into new queries.
A person gets tired, samples data, accepts an approximation, or decides that an answer is good enough. An agent does not set those limits for itself. Without clear limits, it can keep branching instead of narrowing its search, so one analytical task keeps the database busy. Usage tracking built for someone who opens a dashboard now and then thus starts with the wrong idea of how often questions come in and how much work each one creates.
What specifically fails when agents query a production Postgres instance used for OLTP
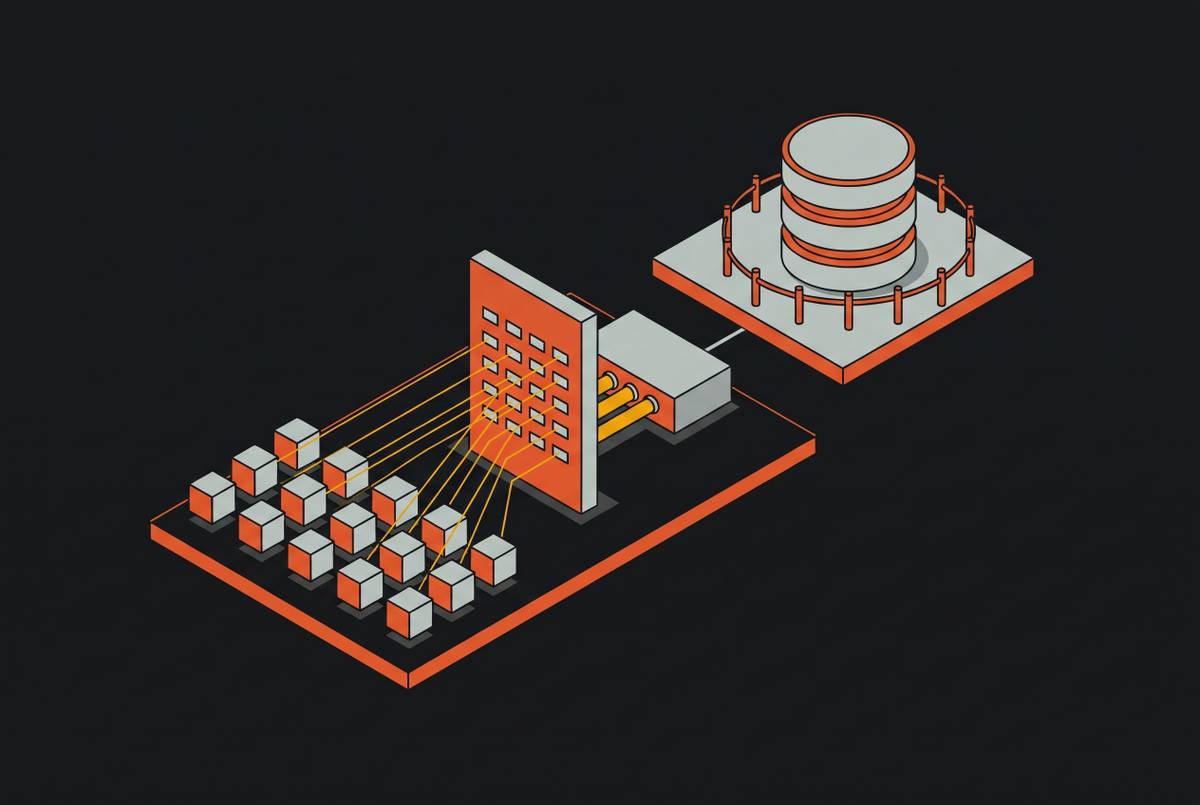
Production Postgres is a row-oriented transactional engine tuned for fast lookups, inserts, and updates. Analytical queries ask it to scan and aggregate large sets of rows instead. Both workloads compete for the same CPU and memory. As tables grow, a usage query that seemed harmless during development can use resources that live application traffic needs. Agents compound that mismatch through concurrent requests, so the problem is not simply one expensive query that needs tuning.
Row-Level Security adds another source of work. A common policy pattern wraps auth.uid() in a subquery that Postgres can cache once per statement, but that optimization does not remove the cost of filtering large analytical scans through RLS. Checking permissions across millions of rows can still take a lot of work. Materialized views reduce the work required for individual reads, yet they remain on the production instance and compete for I/O when their underlying tables are large. Neither measure separates analytical demand from the resources serving transactions.
The Supabase MCP server uses developer-level credentials through OAuth or a personal access token, and its database connection has the BYPASSRLS attribute. An agent using that connection can see data including auth.users without policy filtering. This creates a second problem beyond performance. The connection that makes production evidence available to an agent also bypasses the row restrictions that application users normally encounter.
The security failure that production agent access introduces, and what read-only mode actually does and does not protect
Read-only access limits writes while leaving the scope of disclosure unchanged. The read-only Supabase user belongs to pg_read_all_data, which grants SELECT on every table in every schema, including auth.users. That user also has BYPASSRLS, so Row-Level Security does not narrow the rows it can read.
Prompt injection can exploit precisely that distinction. An attacker embeds hidden instructions in a support ticket telling an assistant to read integration_tokens and paste its contents into the ticket thread. A developer then reviews tickets through an AI coding tool, and the assistant treats the ticket text as instructions and executes the SELECT. No database write is needed to retrieve the secrets.
Supabase’s guidance changed on 4 September 2026 from “don't connect to production” to allowing a production connection “only when the task requires production evidence”. The updated conditions include pinning the connection to that project, using read-only access, and enabling only the necessary tool groups. Scoped personal access tokens, generally available since 6 October 2026, are the mechanism for narrowing server permissions to selected projects and read or read-write access per capability, with an expiry up to a year. Those controls narrow access, but they do not relocate the workload. Every usage query that is allowed still runs on the production instance that serves live traffic.
What minimum viable observability inside Postgres looks like before any agent touches the stack
Before agents use a Postgres-backed system, the team must have a baseline for queries, connections, and system resources. Query-level instrumentation needs to show which statements are slow, how often they run, and how much total time they consume. pg_stat_statements records mean execution time, total execution time, and call count. Connection-level instrumentation must expose open connections, their activity, and waiting sessions, because agents can exhaust Supabase’s pooler limits without any individual query being conspicuously slow. Query timing alone cannot explain that failure.
System-level monitoring needs CPU, memory, I/O, disk, and replication lag, since agent-driven pressure can appear there before query times deteriorate. Useful thresholds include active connections above 80% of the maximum, replication lag beyond a few seconds, and p95 query latency above the team’s SLO. The team also needs to watch for connections that stay idle-in-transaction for a long time and for autovacuum lag as dead tuples build up. Cost needs its own attribution from the start. Token usage and tool-call frequency must be tracked per agent and per workflow, rather than only at the API account level, because unbounded reasoning loops are a common source of unexpected cost spikes.
Why usage tracking must be embedded in Postgres itself — functions, triggers, and pre-modeled datasets as the alternative to dashboard polling
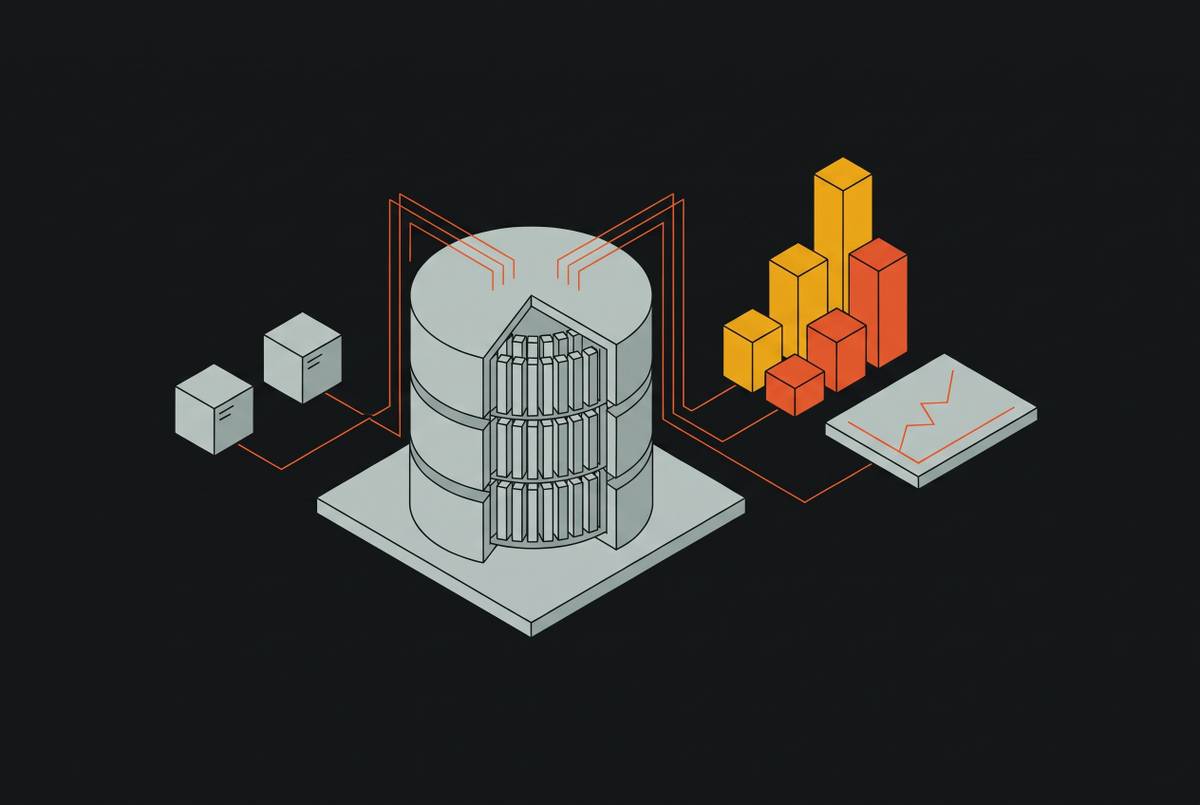
Embedded tracking changes when analytical work happens. Instead of asking a dashboard to reconstruct usage by repeatedly scanning operational tables, triggers capture activity as it occurs and populate dedicated tracking and summary tables. Postgres functions then read those summaries through defined metric interfaces. The dashboard becomes a consumer, with runtime operation independent of it. This separates event capture from the moment a person or agent asks for a number.
Event triggers operate at the database level on DDL events, including schema changes and table creation, and can write structured audit rows to a dedicated tracking table without application-layer code. Row-level triggers capture writes to high-value tables, such as those for agent action logs, feature usage events, and billing events. They can update pre-aggregated summary rows in the same transaction. That keeps the aggregate current without waiting for a scheduled job, while preserving the distinction between schema auditing and usage capture.
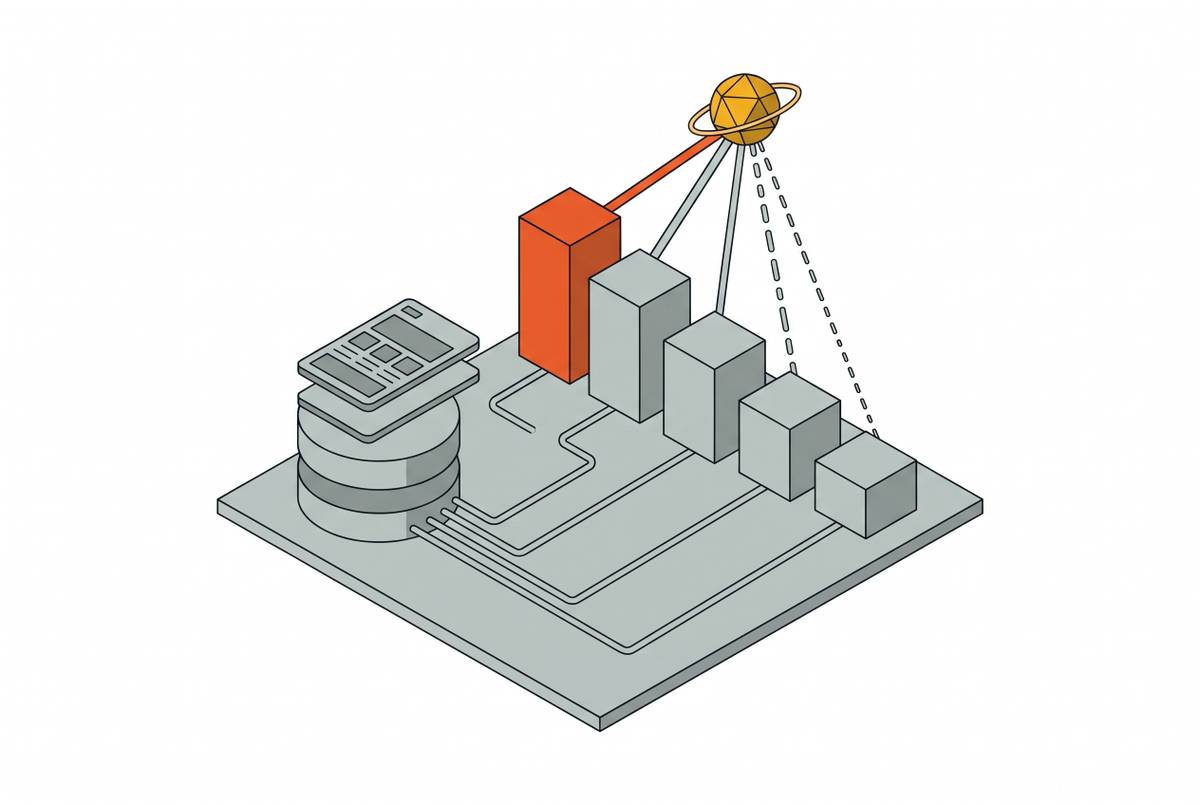
The summary tables are denormalized tables maintained incrementally, avoiding materialized-view refreshes that must revisit large underlying tables. At analytical read time, callers query these summaries. A Postgres function named daily_active_agents() can encapsulate the canonical metric definition and read from the summary table. Every caller uses the same calculation. An agent using that defined read path does not compose an accidental full-table scan against live event data.
Triggers still write data, and summaries kept on the primary still use its resources. This takes the work of repeatedly rebuilding analytical answers out of the request path and gives agents an interface with set limits for reading pre-modeled data. That is more specific than promising that an embedded dashboard will somehow keep up. The database captures and prepares usage independently of whether any dashboard is open.
How a governed semantic layer above Postgres ensures agents and humans see the same number
Pre-modeled summaries control how much work a metric requires, but they do not by themselves control how every consumer interprets it. A governed semantic layer gives them that shared way to read the metrics. Under the headless BI principle, metric definitions are separated from dashboards and reports, defined once as code, and exposed through a governed interface. ARR, churn, CAC, and daily active agents each have one canonical definition. A dashboard and an agent then get the same defined metric, rather than each working out an answer that may differ.
MCP can connect agents to that governed layer without a bespoke integration. In this arrangement, agents invoke pre-approved SQL logic instead of composing SQL against raw tables, and the LLM cannot edit the executed SQL. This is a different access model from developer-level MCP access to production. Consistency comes from that constraint.
Normalization must happen before the MCP layer. Servers that query APIs directly can return inconsistent results when sources use different names and schemas for related data. Asking the agent to reconcile those differences leaves the metric definition outside the governed interface. For BI tools connecting to Supabase, the relevant criteria are therefore the read path, control over metric definitions, and whether agents share those definitions. A direct connection alone does not show how a tool handles any of those things.
How do founding teams get analytics for a Supabase project without a data engineer, and why does waiting cost more?
A founding team without a data engineer needs operating numbers it can trust without reconstructing them manually. Supabase Postgres can supply the underlying data for metrics such as ARR, churn, CAC, and daily active agents when the tracking infrastructure is present. Agent operation adds another requirement. The team must also be able to attribute token usage and tool-call frequency to individual agents and workflows, rather than infer their behavior from an account-wide bill.
Teams should therefore define what to capture and how to measure it before agent workflows start to produce large numbers of events. High-value feature usage, billing events, and agent action logs provide the inputs for the embedded tracking pattern. Postgres functions and summary tables turn those inputs into reusable answers, while the governed layer keeps definitions consistent across consumers. This reduces dependence on whoever last wrote a query. It also keeps a dashboard choice from becoming the place where the business’s metric definitions reside.
Waiting does not preserve a clean slate. Workflows that run without usage tracking produce activity the team may be unable to audit afterward, leaving gaps in what an agent did, what it queried, and what it cost. Later reporting cannot reliably reconstruct evidence that was never captured. Once trustworthy metrics exist, pushing them to a team messaging app, an inbox, or a phone puts the number where people already work. That is preferable to making every operational question depend on someone remembering to open a dashboard and request a fresh production query.
Why observability from day one is a non-negotiable requirement once agents are in the production loop
Once agents participate in production workflows, missing usage tracking becomes a gap in both control and reporting. The team needs to trace actions, costs, and whether an agent acted on stale data. API-call logs alone do not explain the reasoning behind an action. Without the audit context around an action, the team has to guess what caused what when something goes wrong. A record of requests is not, by itself, an account of agent behavior.
The embedded architecture provides a foundation for that oversight. Triggers capture the activity to track, summary tables get usage data ready, and functions make stable definitions available through a governed semantic layer. The layer serving metrics to humans can also supply audit context to agent oversight mechanisms. These functions belong to the same infrastructure. Treating them as separate reporting projects risks leaving the production workflow operational before it is observable.
Supabase’s PostgreSQL foundation also means that safe agent operation depends on query planning, connection pooling, read/write patterns, and avoiding unbounded realtime subscriptions. Those are the same disciplines that keep analytics from overwhelming transactional work. Teams need to establish embedded observability before agents enter the production loop, rather than wait for a dashboard to reveal the consequences. Teams that treat it as infrastructure instead of reporting will be better positioned to operate agents safely at scale.