Postgres as an Analytical Database for Startup Workloads
Postgres can carry startup analytics until heavy scans hurt transactions.
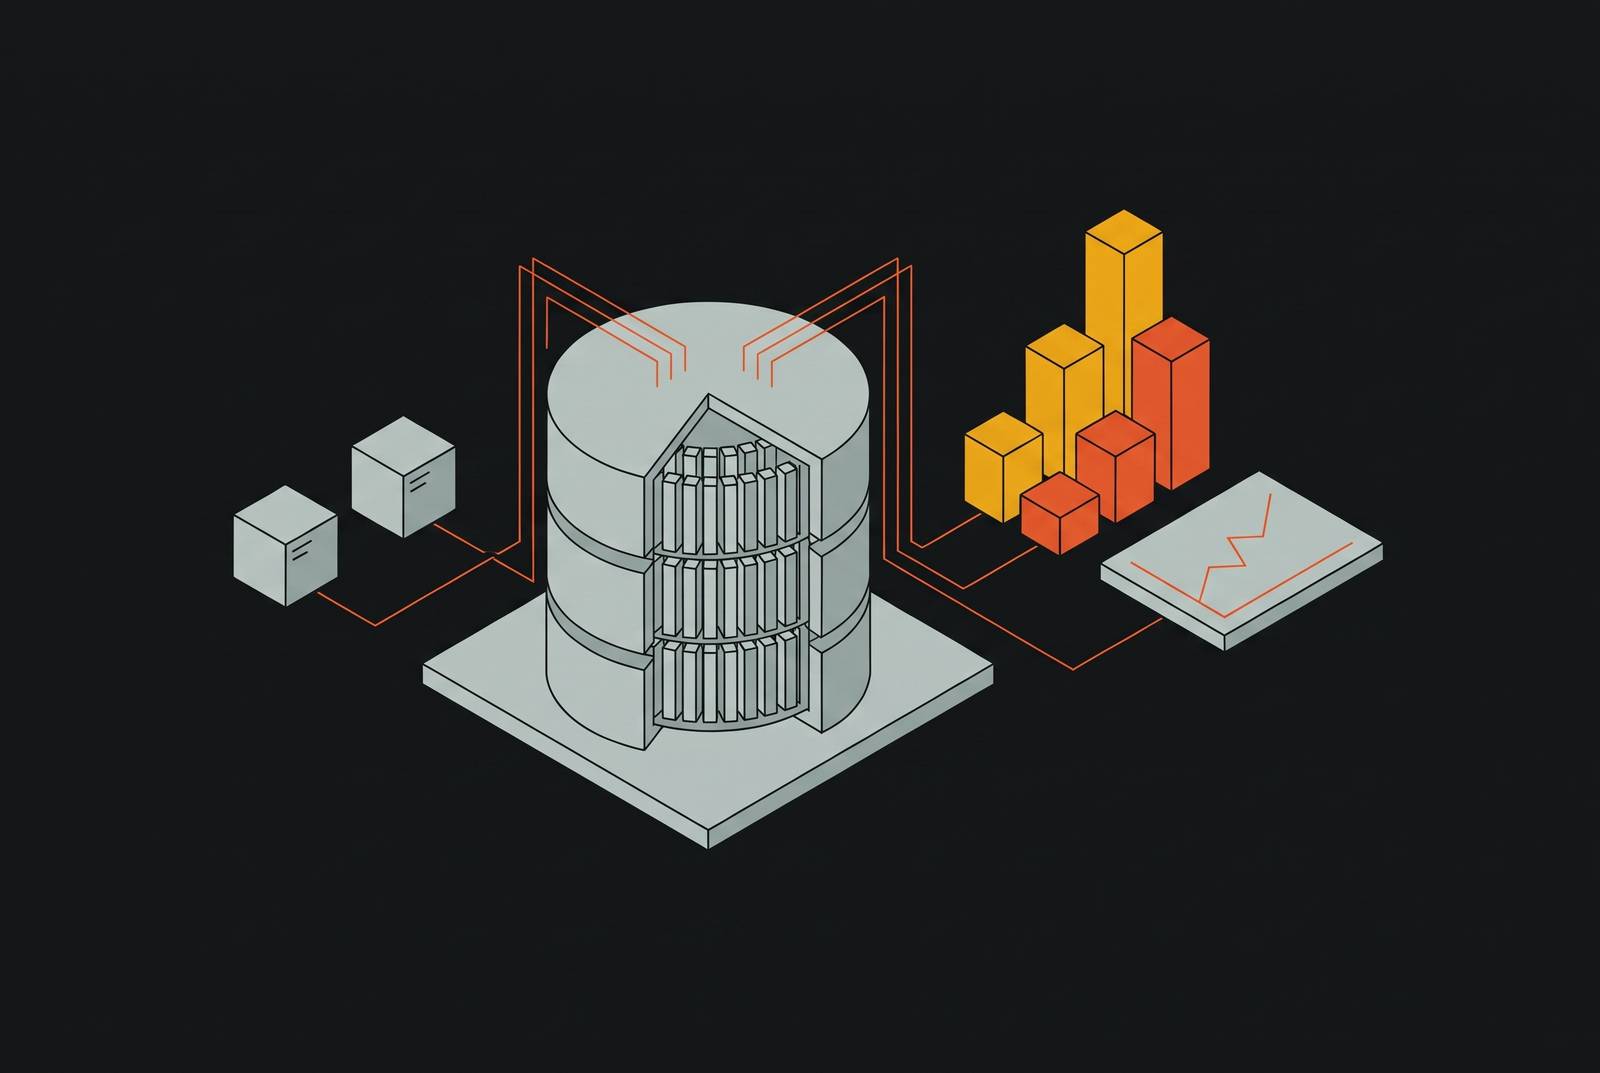
Postgres is a rational analytical default for startups, including Supabase teams, when dashboards query pre-modeled datasets rather than repeatedly aggregate raw production tables. Analytics for Supabase teams should begin with materialized views, controlled connections, and tested permissions. Postgres remains useful longer as a governed analytical home, but heavy analytical work eventually needs separate resources when it competes with transactional latency.
Why startups default to Postgres for analytics — and what that choice actually commits them to
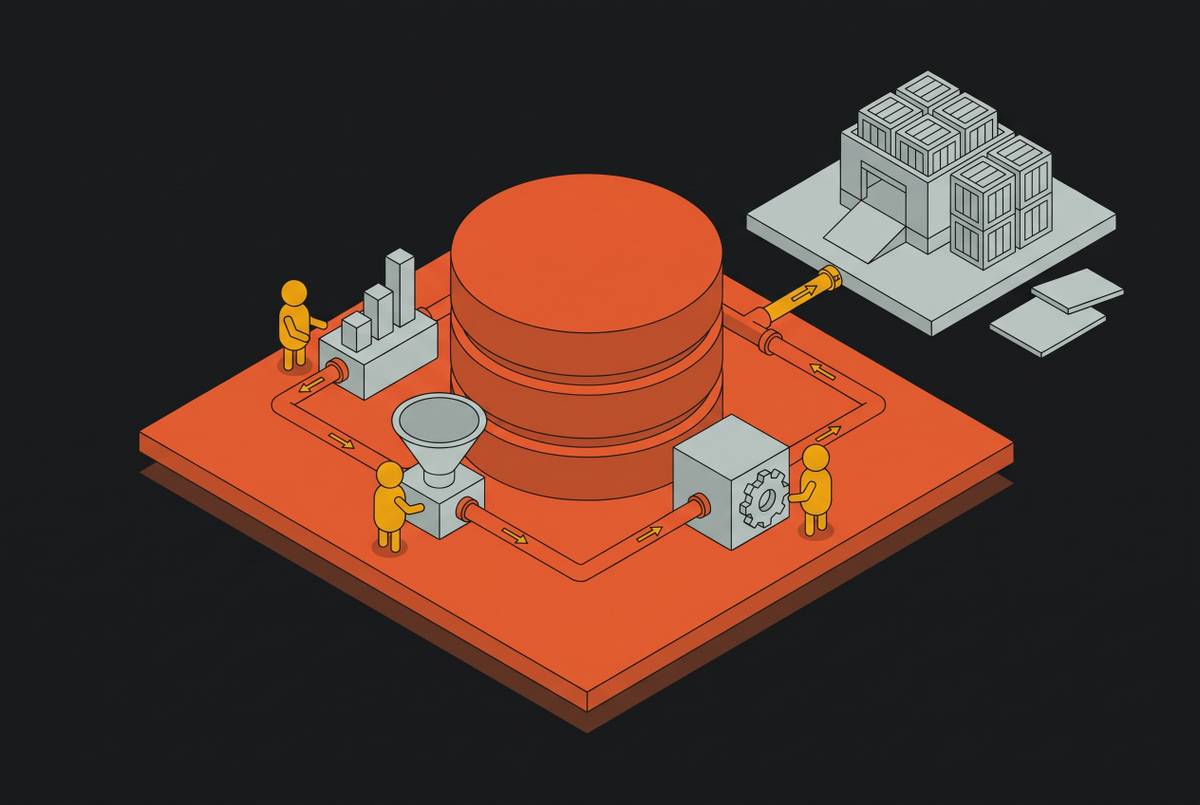
With no licensing cost and standard SQL, Postgres is a low-cost way for startups to get started with analytics. Early teams can build reports without procurement or a separate query language. The data is already in the database. Using it for dashboards avoids adding warehouse infrastructure before the workload justifies that infrastructure, while keeping analytical development close to the application’s existing schema.
The database that serves transactions must also have room to handle reports, aggregations, and dashboard requests. This can be reasonable while analytical demand is modest, but those requests share resources with the application. Choosing Postgres therefore commits a team to managing that overlap.
What row storage actually does to analytical queries — the physics of the ceiling
Analytical queries often need a few columns from many rows, but Postgres stores data by row. Scanning heap tables therefore brings unrelated column data into the read path, amplifying I/O compared with columnar storage. The layout favors a different access pattern. A dashboard that repeatedly aggregates a wide table pays for that mismatch on each scan, even when its result contains only a few values.
Write activity adds another source of overhead. Dead rows accumulate between VACUUM cycles, and vacuum work can consume 10–30% of CPU and I/O in write-heavy workloads. That maintenance competes with query execution as tables grow. ClickHouse’s comparison of extensions shows that in-process engines such as pg_duckdb still run on the same server as the application database.
The limit depends on the shape of the workload. A narrow fact table reaches it later than a wide table, while naturally ordered time-series data offers advantages that randomly inserted events do not. There is no universal row-count boundary. Assessing the limit requires considering how much unnecessary reading and shared-resource contention a workload creates and whether those costs are beginning to affect transactions.
What Postgres tuning can actually recover — and what it cannot
With targeted tuning, the same database can handle much more analytical work. Analytical queries often get too little memory for sorts and hash operations, so giving them more can reduce disk spills during large aggregations. The planner’s cache estimate also needs appropriate configuration. Appropriate parallel query settings, including workers per query and scan thresholds, let large aggregations use the available execution capacity.
Partitioning and indexes address a different bottleneck. Partitioning by time or date allows pruning when a query filters on a recent period, avoiding scans of irrelevant partitions. BRIN indexes suit naturally ordered columns such as timestamps. For that pattern, B-tree indexes take more space and slow inserts without doing much more to help analytical queries. These techniques reduce work only where query filters and data organization support them.
Materialized views are the most useful first-line option for repeated aggregations. They compute an expensive result once and store it, so later dashboard requests use lookups without repeating the scans and calculations. The computation moves to the refresh process. None of these techniques, however, changes the underlying heap layout or isolates analytical work from transactions on the same instance. Tuning removes avoidable costs.
Extensions that shift the ceiling by changing where analytical compute runs
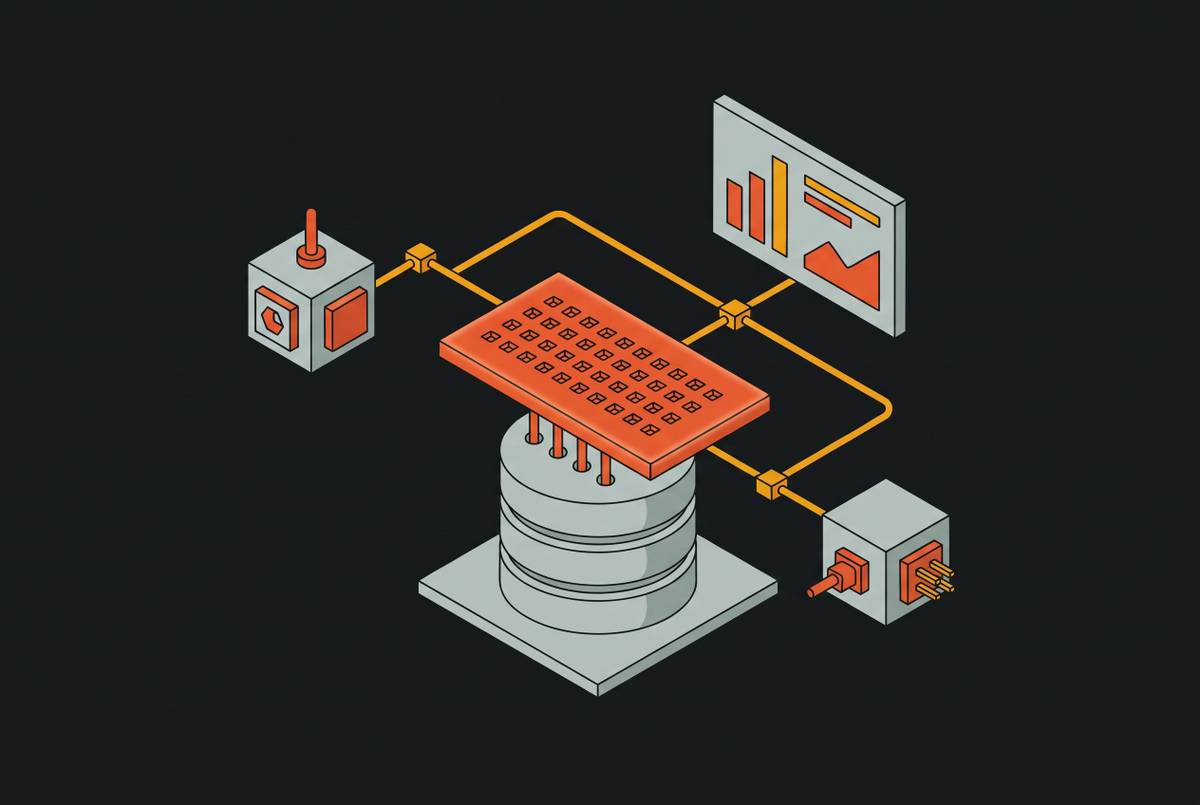
ClickHouse’s 2026 extension comparison distinguishes four architectures, including embedded engines, same-host sidecars, columnar storage in Postgres, and query pushdown to a separate engine. Location is the decisive difference between them. An extension may improve execution or storage while queries still compete for CPU, memory, and disk. A separate engine can isolate that demand, but introduces another system to operate.
Embedded approaches include pg_duckdb and pg_mooncake. DuckDB runs inside Postgres backend processes and can query existing heap tables without copying the data. High-cardinality GROUP BY operations and distinct counts can benefit, although simple scans can be slower than plain Postgres. Adoption does not provide resource isolation. Both embedded execution and a same-host sidecar leave analytical work on the transactional server.
Columnar approaches change storage while keeping computation in place. TimescaleDB Hypercore v2.31.0, as of 2026-10-20, combines a hypertable and continuous aggregate model designed for time-series workloads. Citus columnar v14.3.0, as of 2026-10-23, provides on-disk columnar storage with a distributed query planner. AlloyDB’s columnar engine instead materializes hot columns in memory while transactional traffic uses the underlying row store.
The pg_clickhouse foreign data wrapper v0.11.0, released 2026-09-30, pushes filters, GROUP BY, aggregates, ORDER BY, LIMIT, joins, and window functions to ClickHouse, with subqueries supported on ClickHouse 25.8+. Analytical execution uses the remote server’s resources, leaving Postgres transactional throughput largely unaffected. EXPLAIN (VERBOSE) exposes the remote SQL for inspection. The trade-off is operating and synchronizing a second system.
How managed Postgres providers position themselves around the analytics problem
AlloyDB combines transactional storage with an in-memory columnar accelerator, priced per vCPU and memory per hour plus storage. Citus suits larger sharded workloads through distributed planning and on-disk columnar storage. Its former managed offering requires caution, however. Microsoft’s Cosmos DB for PostgreSQL is on a retirement path with new deployments blocked, and Azure Database for PostgreSQL with Elastic Clusters is the replacement.
Neon focuses on branch-per-PR development and the savings from scale-to-zero, with 100 compute-unit-hours per project and multiple branches in its free tier. Its Launch and Scale plans differ in compute pricing but charge the same storage rate. Crunchy Bridge offers managed Postgres across clouds for teams that need specific extensions or settings. Its analytical paths include a separate Crunchy Data Warehouse cluster with managed logical replication, read replicas, or external CDC.
ClickHouse Managed Postgres takes the separate-engine approach. It combines production Postgres on local NVMe storage with ClickPipes and pg_clickhouse, leaving Postgres as the transactional system of record while analytics runs on ClickHouse resources. Timescale has rebranded, its managed product has a separate name, and its open-source extension remains TimescaleDB. Naming does not replace an architectural comparison. For teams standardized on the cloud provider behind Amazon RDS and Aurora, those services remain defaults, but neither changes the row-storage layout, so larger instances do not remove the cost of heavy analytical scans.
How do Supabase teams get analytics and dashboards without overloading production?
Supabase adds connection, permission, and observability constraints to the standard Postgres analytics problem. Its core remains Postgres, so schema design, targeted indexes, and query analysis usually deserve attention before additional compute. For dashboards, materialized views of daily statistics or revenue rollups avoid recalculating the same aggregates on every request.
Supabase direct connections range from 60 to 500 depending on compute size, while pooled connections extend into the thousands. Long-running analytical queries still take up capacity that transactions need. Most applications run into limits in planning, indexing, and schema before they reach the platform’s limits, but pooling leaves the work done through each connection in place.
Policies can change query plans and latency in ways that light testing misses, so RLS-heavy analytical queries should be load-tested to check their cost. Instrumentation is equally important from the start. Supabase’s documentation surfaces agent-readable observability across health, security, performance, and resource cadences, while missing instrumentation leaves teams discovering regressions through user impact.
A BI tool that connects directly to Supabase needs to be assessed on its query surface, how it uses connections, and its permission boundaries. Dashboards should read controlled, precomputed results. Agent access brings the same workload risks as well as the risk of row-level security bypass, and both risks remain even with more connection capacity.
Why Postgres as the analytical home means pre-modeling data, not querying it raw
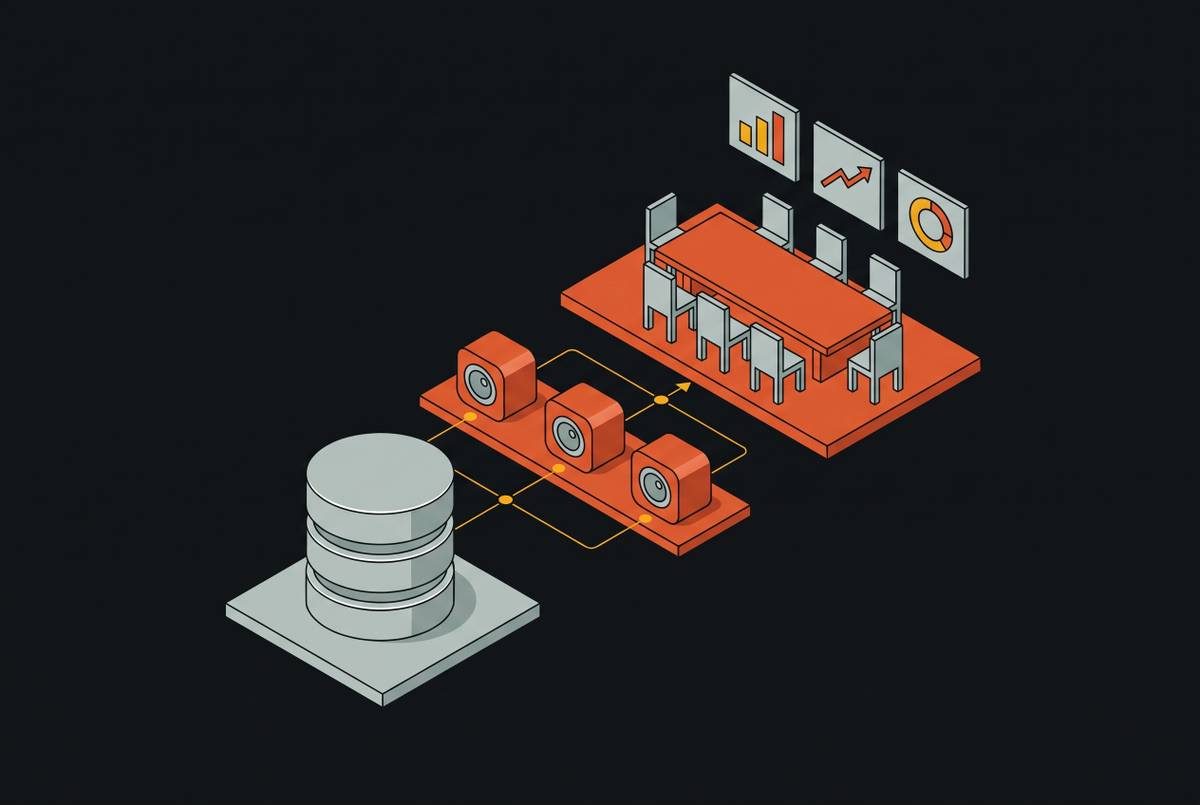
The governing principle is to separate modeling from querying. Raw analytical requests from dashboards, cron jobs, or agents repeatedly ask heap tables to perform the same aggregations. Each request renews the storage-layout penalty. Pre-modeling moves that work to a scheduled, controlled moment and stores the result as a materialized view, a columnar copy, or a governed Parquet dataset optimized for reading.
This creates a smaller analytical surface with defined meaning and access rules. Consumers query prepared datasets rather than reconstruct business logic against production tables on demand. Postgres can still be the analytical home while some analytical reads run elsewhere. DuckDB suits the Parquet version of this pattern because it reads columnar files efficiently, runs in-process without a server, and can query governed datasets without touching the production instance.
A materialized view inside Postgres reduces repeated computation, while a governed dataset queried elsewhere can also remove consumer traffic from production. Those options offer different degrees of isolation. Both apply the preparation-before-querying pattern used by columnar warehouses, without requiring a startup to abandon a database that still serves its transactional workload correctly.
How AI agents change the access problem — and why pre-modeled data is the safe answer
For agents, knowing who the user is only partly establishes what they can access. Their access also needs boundaries around which data they can use, under what circumstances, and for what purposes. RLS on live tables does not answer all of those questions. Direct agent queries can exhaust connection pools or cross permission boundaries, and neither pooling nor a change in transport protocol resolves those data-layer risks.
A safe way to give agents access is to put a governed analytical copy behind an MCP server. Agents discover available datasets and request them by name through Resources and Tools, with no agent queries reaching the production instance. The copy becomes the enforced access boundary. Pre-calculated Parquet datasets queried through DuckDB provide inexpensive analytical context without consuming production connections, extending the same separation that benefits dashboards.
MCP supplies access, while a semantic layer supplies meaning. Metrics, entities, relationships, and governance policies are necessary for trustworthy answers. A governed MCP layer gives agents a single access-controlled interface regardless of the model behind them. With that shared interface, each agent no longer needs its own connector, but access must stay within the governed datasets to keep it safe.
When to stop extending Postgres and what that decision actually looks like
The decision to move depends on whether analytical demand competes with transactional latency in ways that pre-modeling and extensions can no longer isolate. Refresh windows are one concrete signal. When materialized views take so long to refresh that dashboards regularly present stale data at critical moments, the preparation process has become a constraint of its own.
Other signals show that isolation is becoming difficult to maintain. Read replicas intended to protect the primary may themselves become analytical bottlenecks, while analytical connections can put pressure on transactional latency. Columnar extensions may also demand dedicated engineering attention to balance compression and freshness. These costs belong in the architectural decision. Adding another extension or replica to Postgres can cost too much even when that option is still available.
At that point, a purpose-built columnar engine is the appropriate next step. The workload has outgrown what a row-store with analytical extensions can govern cleanly. Pre-modeling makes the transition less disruptive. Metric definitions, governed datasets, and established access patterns can move with the analytical compute layer, avoiding a rebuild during a production crisis. Preparing that model inside the Postgres ecosystem is sound architecture from the beginning.