Replacing the Warehouse Tier With an Agentic Dashboard Backend Inside Supabase Postgres
A governed layer serves dashboards and agents without touching production.
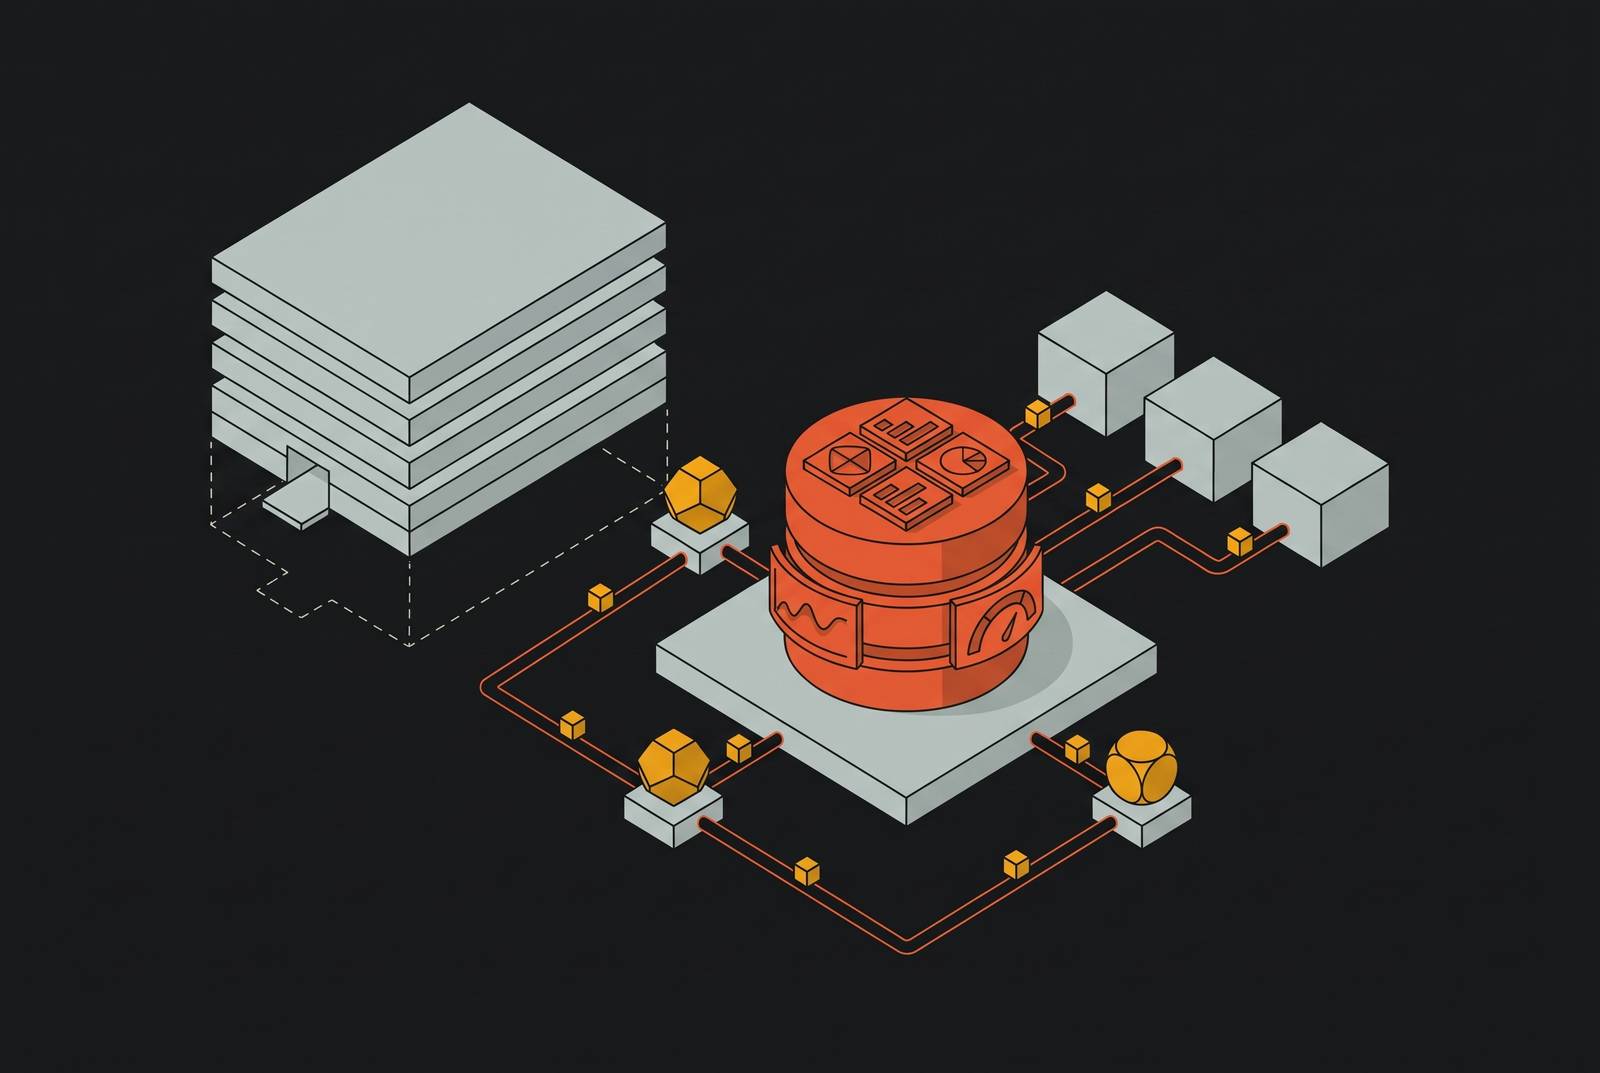
Analytics for Supabase teams can serve dashboards and AI agents without adding a warehouse tier or exposing production Postgres to analytical queries. The replacement is a governed backend that serves pre-calculated datasets through MCP, with shared metric definitions and per-request authorization. Its viability depends on separating analytical reads from production.
Why Supabase teams keep hitting the same analytics wall
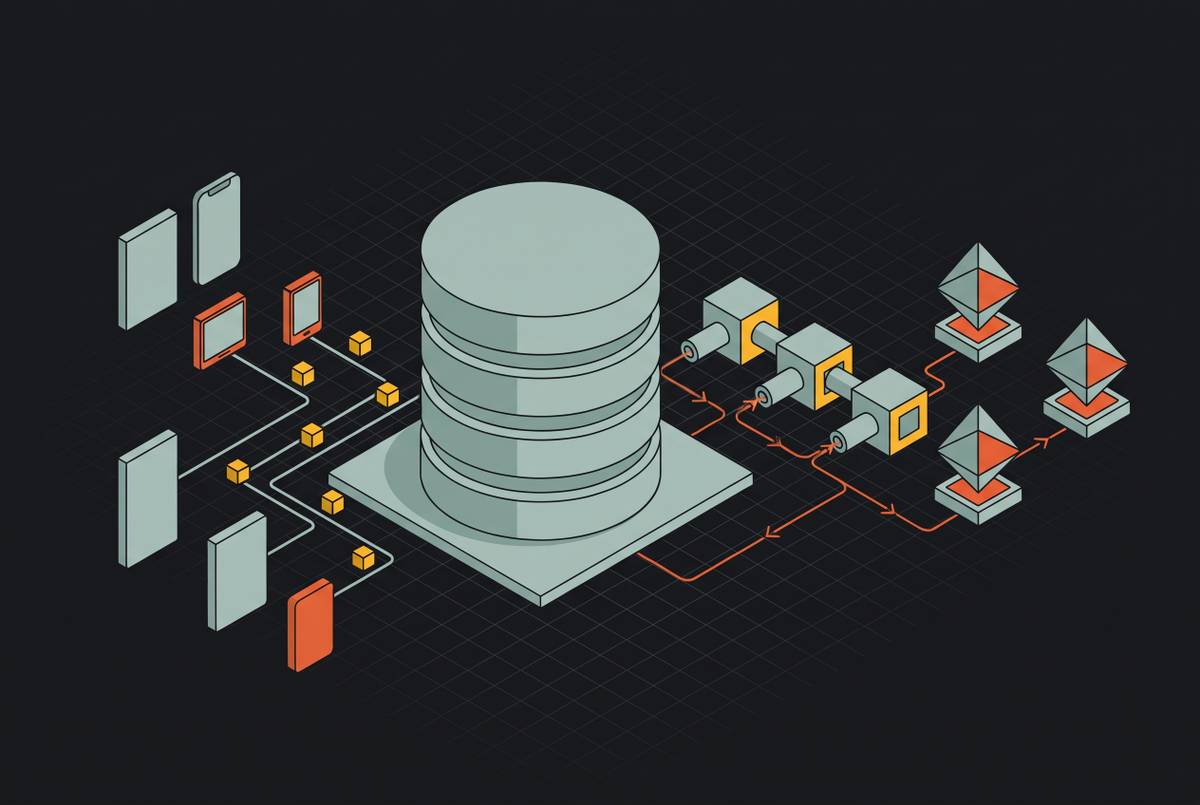
A founder needs a revenue dashboard and is told to “set up a warehouse.” The application already runs on Supabase, the underlying records are in Postgres, and nobody on the team owns data infrastructure. Yet the conventional path introduces a warehouse, dbt, and a BI tool before the team has answered its first business question.
That path assumes someone will manage extraction, transformation, and schema synchronization. For teams with dedicated data headcount, those responsibilities have an owner. For an early Supabase team, they become additional work for the people building the application. The raw material exists from day one, but turning it into dependable analytics appears to require a separate engineering function.
The standard stack bundles the need for consistent metrics with a particular way of storing and processing analytical data. Those are related needs, but they are not identical. A team needs reporting definitions it can trust and workloads its application can tolerate. The need for a separate warehouse depends on how those requirements are met.
What actually breaks when you point a dashboard at production Postgres
Connecting a BI tool directly to production avoids the warehouse setup, but it leaves analytical work competing with the application. Reporting queries encounter row-level security rules designed around transactional access. Those rules can create friction when a report needs to aggregate records across a broader scope. Connectivity alone does not make that scope appropriate.
JSONB columns that work for the application are not necessarily fields a BI tool can chart cleanly. Meanwhile, scan-heavy aggregations consume the same compute budget as transactional requests, and concurrent dashboards can exhaust the connection pool. A dashboard is not merely a passive view when every refresh requires database work.
The available infrastructure responses come with a bill. Upgrading compute gives the shared workload more capacity, while provisioning a read replica roughly doubles database compute spend. A replica can move reads away from the primary, but neither option resolves the mismatch between transactional records and analytical datasets. Row-level security decisions, JSONB interpretation, and metric definitions still need attention.
A report can be difficult to authorize, awkward to model, and expensive to run at the same time. The resulting cost is a predictable consequence of using a transactional instance as an analytical backend.
Why AI agents make direct production access a harder problem, not just a bigger one
An AI agent accelerates the workload while making access permissions harder to enforce. It can exhaust connection pools faster than a human analyst, and it cannot be relied on to stop when a request approaches an authorization boundary. The database credential determines what it can reach. The model’s judgment is not an enforceable access policy.
Uchi Uchibeke’s March 2026 paper, Before the Tool Call: Deterministic Pre-Action Authorization for Autonomous AI Agents, identifies the gap as authorization before execution. Agents can make tool calls, including database queries, without a standard way to check permission before the action runs. Model alignment is probabilistic. Checking an action after it runs cannot take the place of deciding whether to let it run.
A pilot can establish the wrong boundary early. A broad database credential unblocks the demonstration, then becomes permanent because access scope is never revisited. Read-only access still exposes every row within the credential’s reach, requires separate measures to provide a per-request audit trail, and leaves analytical requests competing for connections.
For Supabase, this combines connection-pool exhaustion with the risk of row-level security bypass. Adding capacity leaves the scope of a credential unchanged and does not add request-level authorization. Wrapping that credential in MCP is also insufficient. A long-lived static API key or personal access token remains a standing grant unless the backend makes a separate access decision for each request.
The governed layer concept: separating analytical data from the production instance
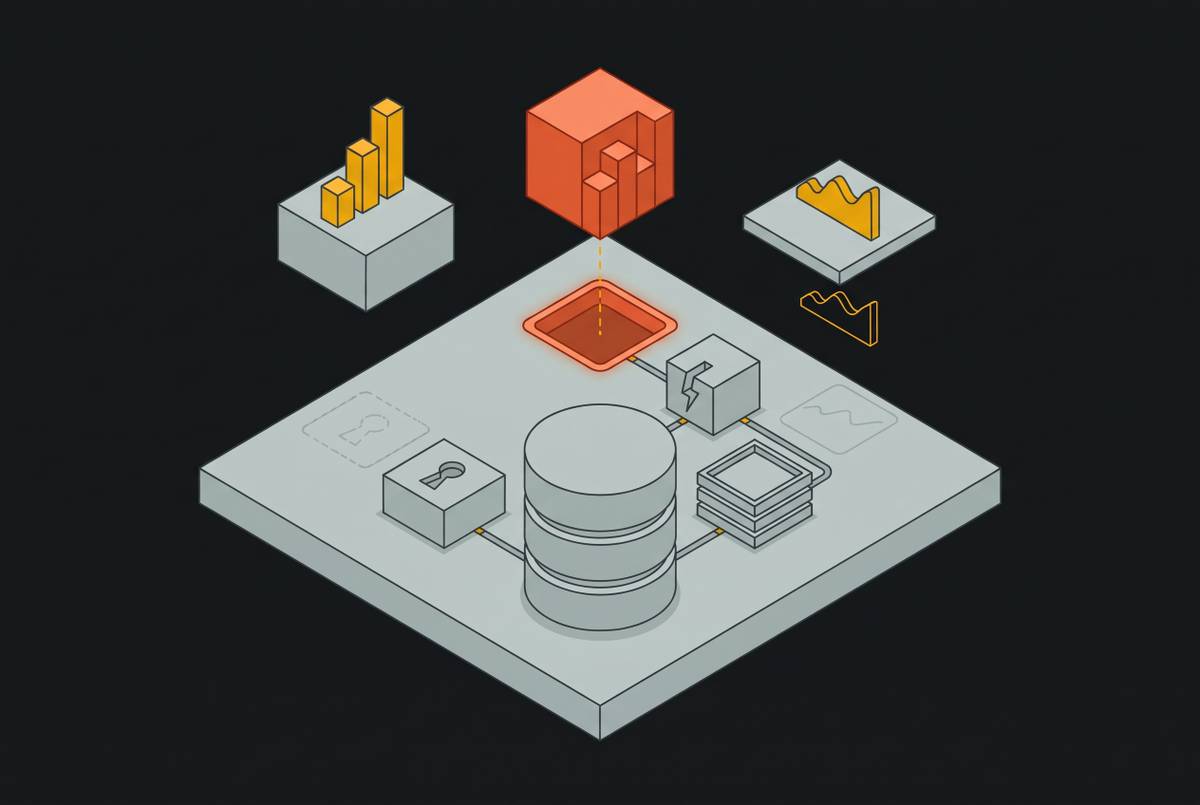
A governed analytical layer resolves both problems by changing what consumers can query. It serves pre-modeled datasets calculated ahead of time and stored in a columnar format, rather than forwarding analytical requests to production Postgres. The structural boundary makes production unreachable from the analytical read path.
Governed Parquet datasets queried through DuckDB provide the analytical shape that transactional tables lack. Columnar scans and inexpensive aggregations operate on those datasets without consuming production connection-pool slots. The datasets sit beside the database rather than duplicating it in a separate cloud cluster. This is a Postgres-native architecture in the sense that it builds around the existing Supabase database.
The access boundary sits in front of those datasets. On each request, the governed backend evaluates the requesting identity and returns only the rows and columns that identity is entitled to see. The backend retains the broad database credential, whether the consumer is a dashboard or an agent.
Uchibeke’s framework also describes how pre-action enforcement can extend to quality gates and operational contracts. At that same point, the backend can check both whether a request is allowed and whether it meets the conditions to run. The warehouse replacement is not simply a faster file format. It combines an analytical data shape with an enforceable boundary, removing the need for consumers to exercise restraint around production.
How MCP turns the governed layer into an interface both dashboards and agents can consume
MCP gives the governed backend a common interface for different consumers. Instead of maintaining N×M application-to-source connectors, a common protocol requires one implementation per application and one per source. For a Supabase builder, the practical value is one analytical backend that can support multiple interfaces. Each consumer reaches the same datasets rather than implementing a separate route to the database.
The protocol exposes three relevant primitives. Tools execute actions such as querying a governed dataset. Resources provide context, including schema definitions and available datasets, while Prompts supply reusable templates for analytical workflows. Together, these primitives expose both data access and the information an agent needs to interpret what it retrieves.
That context is essential to the shared-backend design. An agent can discover an available dataset through Resources and request it by name through Tools. The governed server checks what the requesting identity has permission to see and provides the metadata needed to judge whether the data can be trusted. Authorization remains the backend’s responsibility.
A Claude instance and a live dashboard can consequently answer from identical metric definitions when both consume this governed interface. Their presentation differs, but their underlying result does not need to.
Metric drift: why pre-modeled datasets are the solution, not just a performance optimization
Sharing access is not enough when every consumer calculates its own metrics. One engineer writes a revenue aggregation, another writes a different aggregation for the same metric, and both results appear in reporting. The discrepancy may remain unnoticed until an investor asks for audited figures.
The discrepancy does not necessarily come from incorrect SQL. Two queries can execute successfully while answering different versions of the same question. If the definition lives only inside each query, the dashboard label does not show that difference. Moving those queries to a warehouse would change where they run, but would not by itself reconcile what they mean.
Pre-calculated datasets put a data dictionary pattern into use. Each metric has one definition, calculated once, and consumers read that result. This makes pre-modeling a correctness mechanism as well as a performance choice. The dashboard and the agent share the calculation.
Agents make this distinction more consequential because they can invent metric logic at query time when no definition is available. An answer produced that way is neither auditable nor reproducible as a canonical business metric. A named, pre-modeled dataset removes that interpretive step from the consumer. Metric governance belongs in the governed layer, where the team sets definitions before anyone uses them. A warehouse was one place to put that responsibility.
What observability Supabase teams need before the agentic layer goes live
Separating analytical traffic does not eliminate the need to observe production Postgres. Without latency dashboards and query-level metrics, a team cannot distinguish connection-pool pressure from an application bug or a misconfigured agentic workflow. The boundary needs verification that it holds. Observability is therefore a prerequisite for deployment.
Before launch, a team can start watching the system through Supabase’s Metrics API. It exposes Postgres performance and health metrics in Prometheus exposition format. Those signals provide the foundation for watching the underlying instance while the governed backend serves analytical consumers. They also keep production health visible even when analytics no longer runs there.
Query-level visibility requires a more specific signal. The minimum is pg_stat_statements, enabled by default on most managed Postgres, which records mean execution time, total execution time, and call counts per query. Latency alone shows that something is slow, while query statistics help locate the work responsible.
Active connection count approaching the limit set by max_connections is the critical danger zone. Supabase provides connection pooling and read replicas for infrastructure responses, with log drains supporting visibility into system activity. Those tools help only if the team watches the signals that show when to use them. A governed architecture is intended to keep analytical reads off production, but monitoring must reveal when the instance is under pressure rather than assuming separation has solved every workload problem.
How do early Supabase teams get analytics and dashboards without a data engineer?
Early teams can operate this architecture without building every component themselves, provided the governed layer is already built for them. The required capabilities are concrete, including governed Parquet datasets, an MCP server, pre-calculated metrics, and observability connected to production Postgres. A database connection alone is not equivalent. The distinction is whether the backend owns the analytical model and access boundary or leaves both to each consumer.
Teams weighing BI tools that connect directly to Supabase need to compare how they are built as well as how they look. Direct production access is simple to establish but retains the workload and permission coupling. A warehouse stack introduces a separate tier and the extraction, transformation, and synchronization responsibilities that come with it. A governed backend serves analytical datasets beside the existing database without the need for a separate warehouse cluster or the conventional warehouse ETL stack.
Tools still cannot decide every business definition. Teams that need help with metric definitions, reporting cadence, and stakeholder alignment can use a fractional data partner to fill that leadership gap. That need is distinct from operating the backend. A platform can enforce a definition once it exists, but the organization must still decide what the metric means.
Waiting to hire a data engineer leaves those decisions accumulating inside dashboards and agent queries. Governance is easier to put in place before teams get used to working with conflicting definitions. The concrete next step is to define the revenue metric the team needs, establish which identities may see it, and select a built layer that serves that governed result to both dashboards and agents. Production observability belongs in that initial setup, before the agentic interface goes live.