Postgres Connection Pooling Limits Under Analytical Query Load
Pooling cuts connection overhead but can't fix long analytical scans.
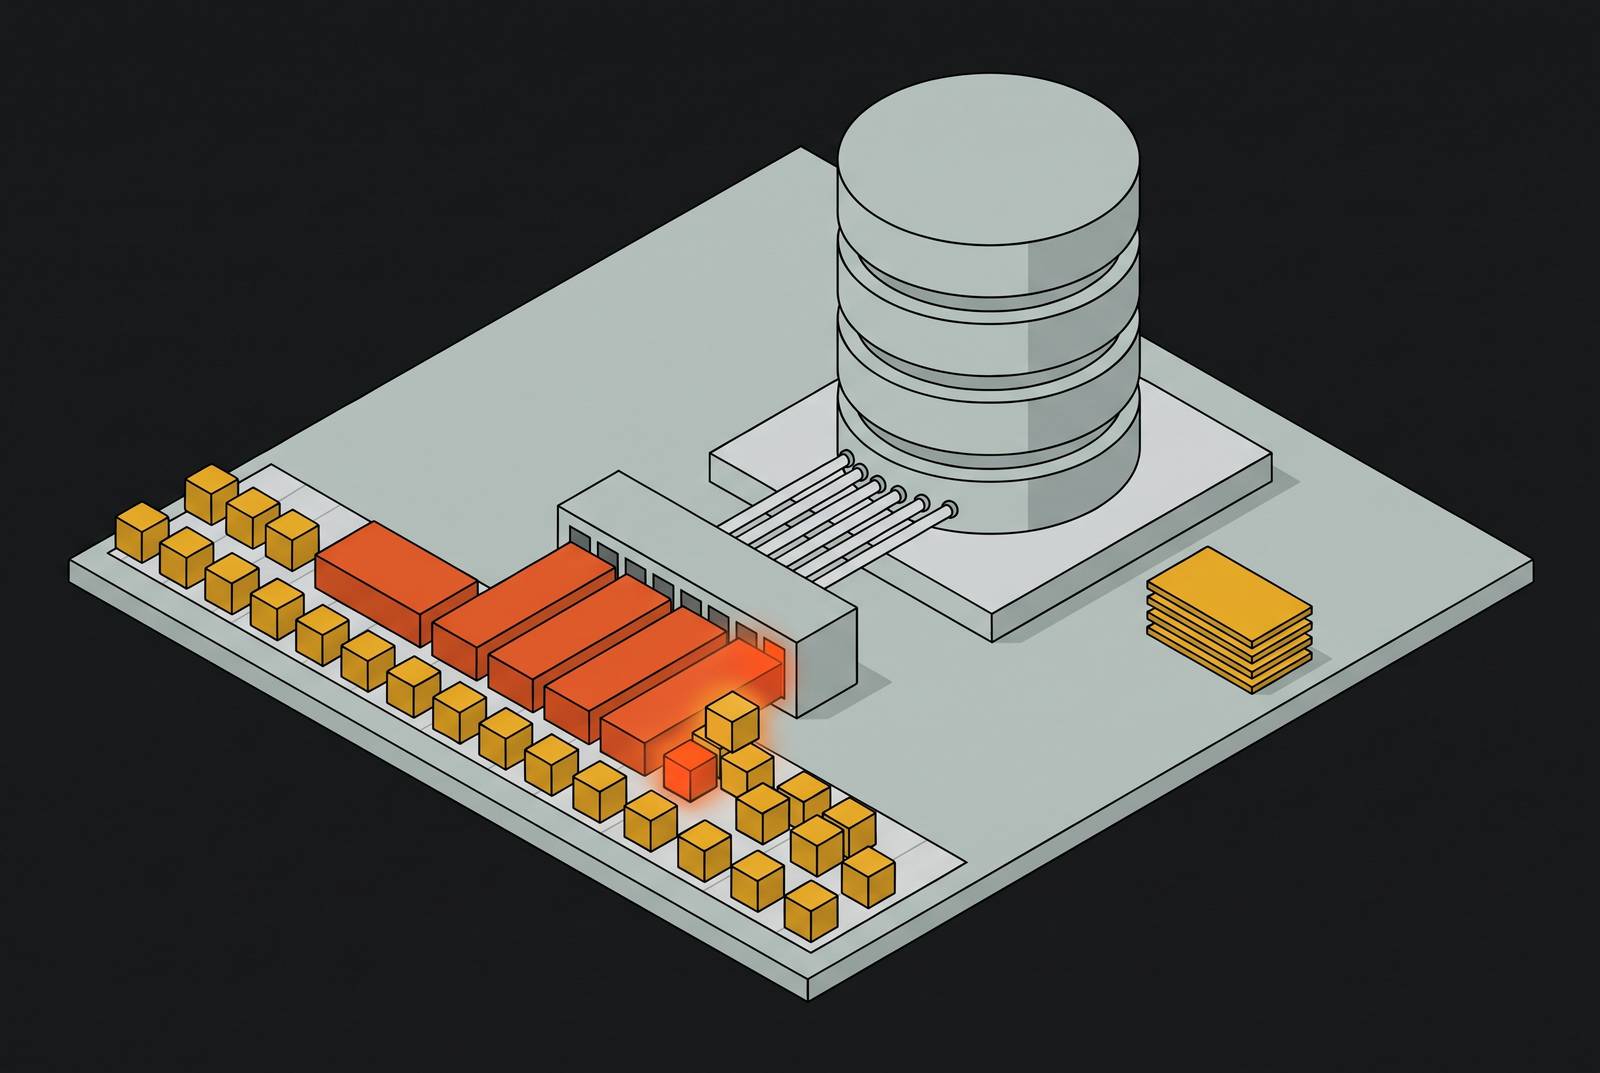
Analytics for Supabase teams should keep expensive dashboard queries off production connections, using pre-materialized metrics where possible and separate analytical compute when needed. Postgres connection pooling has limits under analytical query load because long scans and aggregations tie up scarce backend processes and compete with application traffic for memory and CPU. Pooling reduces connection overhead, but it cannot remove that competition.
Why Postgres connections are expensive before any query runs
Every Postgres connection is a dedicated OS process. Establishing it involves a TCP handshake, TLS negotiation, authentication, a process fork, shared catalog loading, and session parameter setup before the first query runs. That work takes time. Hardware, network conditions, and authentication method affect the cost, with SSL and scram-sha-256 adding to connection setup on a real network.
Each connection also consumes roughly 5–10 MB of RAM through private process memory, shared buffer state, and lock structures. With the typical default of max_connections = 100, the memory used by connections alone comes close to 1 GB at the upper end of that estimate. At 500 connections, it approaches 5 GB. On a 16 GB server, that idle process overhead can take up a large share of memory before queries need any working space.
A restart makes this cost particularly visible. When every application server reconnects at once, the postmaster gets a flood of fork calls. This thundering herd can extend recovery beyond the original outage because restoring connections becomes a significant workload in its own right.
How analytical queries impose a categorically different resource footprint than OLTP
An OLTP transaction typically holds a connection for milliseconds, performs a point read or small write, and releases it. A scan with joins, sorts, and aggregations can hold its backend for seconds or minutes, occupying the process throughout. Analytical queries combine longer occupancy, larger working memory, and contention with unrelated transactions.
Memory adds to the strain because work_mem applies to each sort or hash operation within a connection. A query with multiple sort nodes and hash joins can need several times as much working memory. Meanwhile, a large sequential scan can evict OLTP data from the shared buffer cache. Point reads then lose their cached data. Application latency can spike even though the analytical query never updates the rows those requests need.
The damage can also outlast the query itself. Long-running analytical queries can hold locks that block autovacuum, allowing table bloat to degrade the primary application. CPU-heavy sorts and aggregations also get in the way by competing for the internal lock manager, shared buffers, and WAL writer. Beyond the optimal connection count, admitting more work makes execution less efficient. CPU-heavy workloads therefore need fewer concurrent connections.
How the failure actually unfolds: the latency cliff and what triggers it
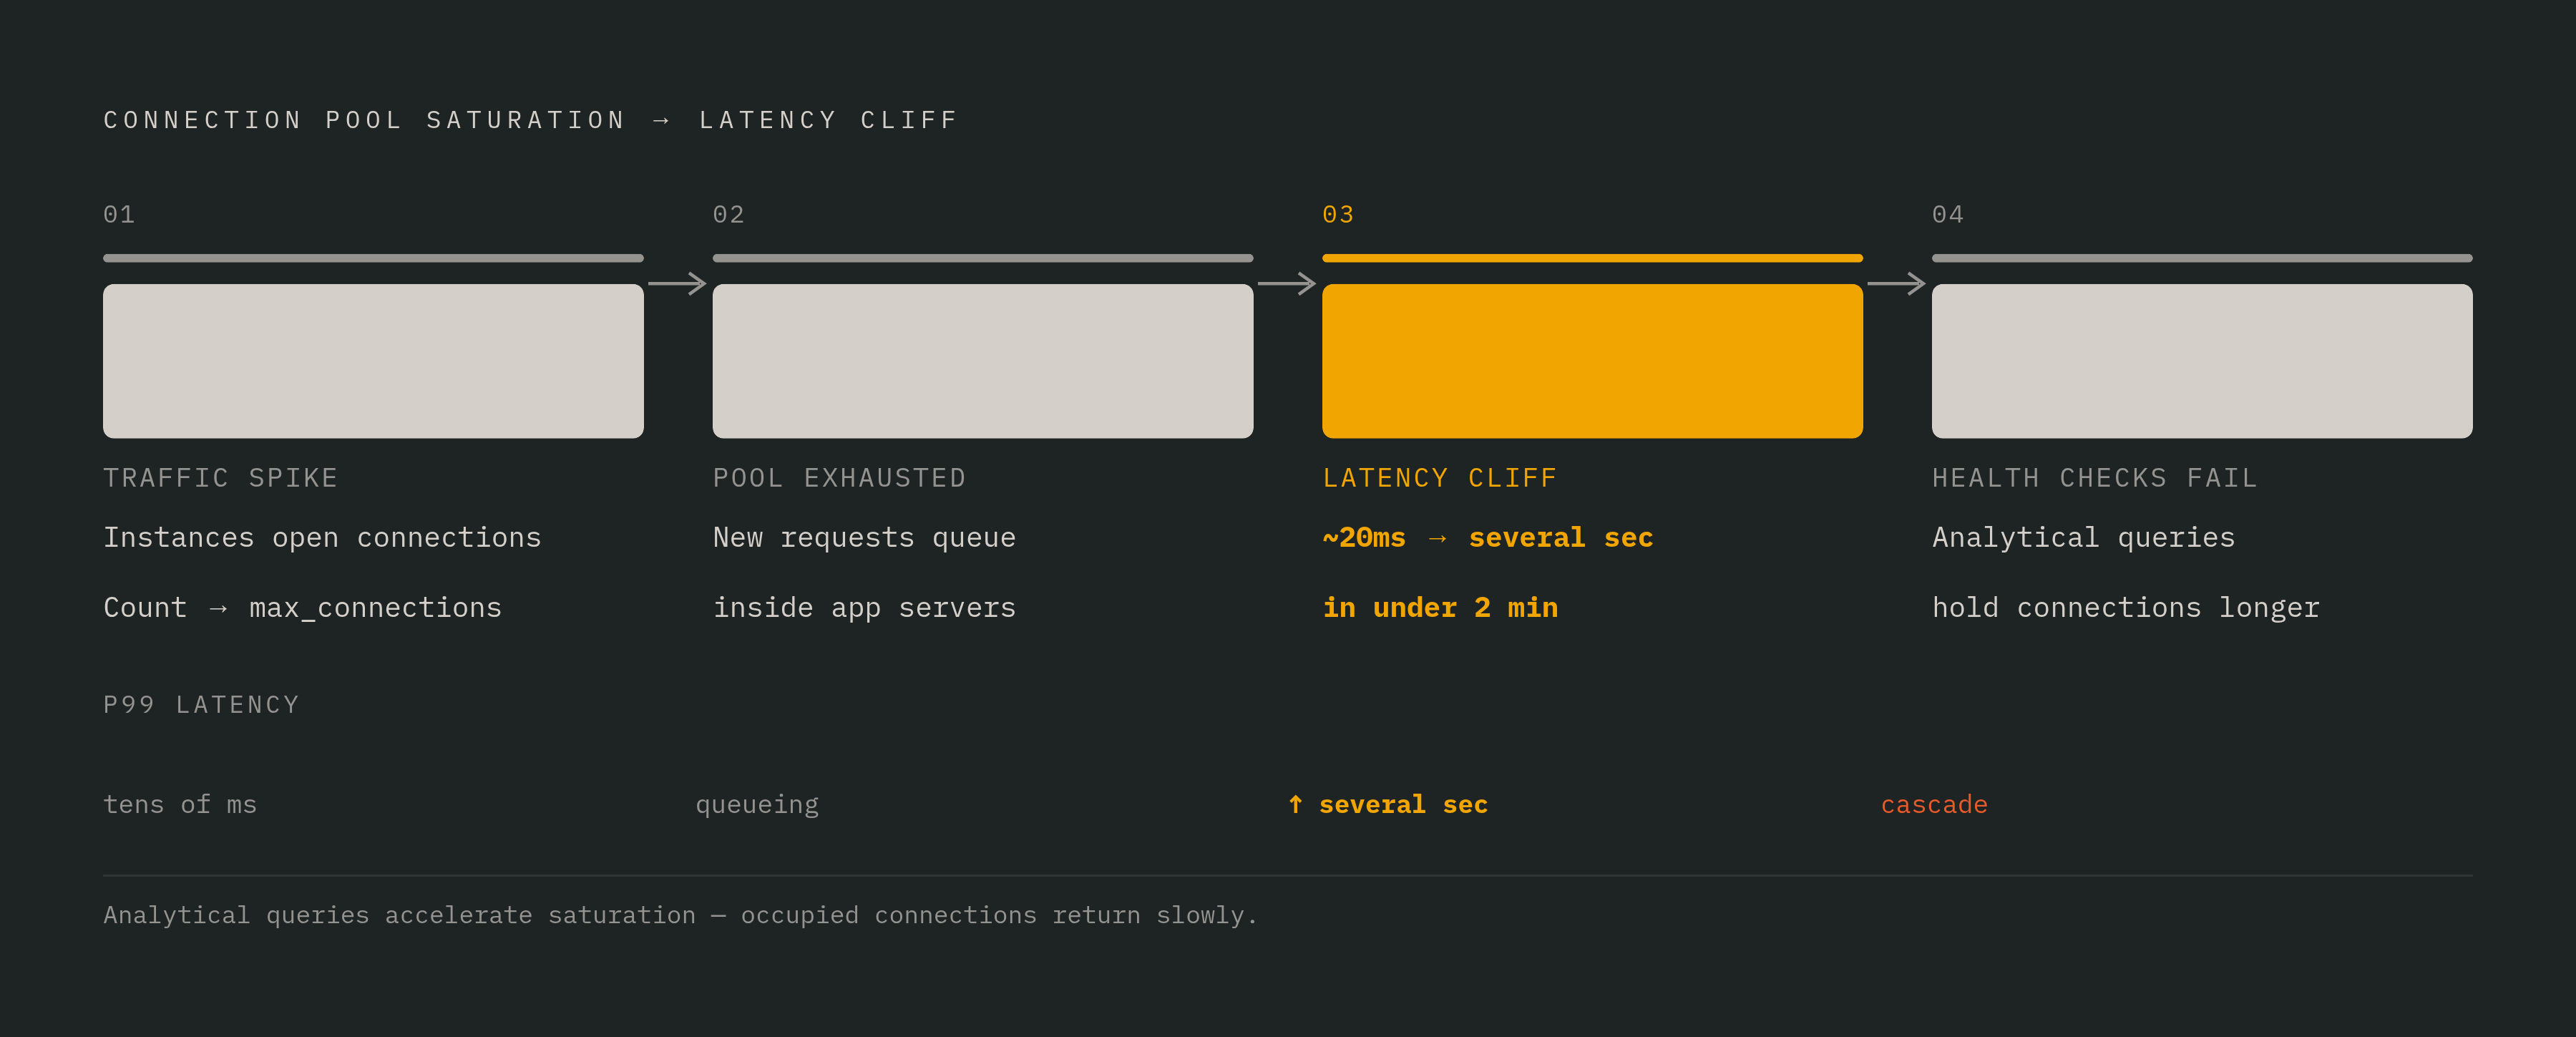
Pool exhaustion produces a latency cliff. When traffic spikes, application instances open connections until the count gets close to max_connections. New requests then queue inside application servers, waiting for a free connection. As this failure unfolds, p99 latency can rise from tens of milliseconds to several seconds in under two minutes, after which health checks fail. Analytical queries accelerate saturation because occupied connections return slowly.
The usual dashboards can conceal the bottleneck. Application CPU and memory may look normal, while database CPU may stay low because requests are waiting to run. A vertical rise in p99 latency paired with a flood of idle in transaction connections in pg_stat_activity is a strong diagnostic signal. Load tests can miss this sequence when they run at 2× normal traffic but stop before the pool saturates. OLTP-only tests can be especially misleading when production also holds connections open for seconds.
A team serving high QPS with pgvector on AWS RDS encountered this failure during a marketing-campaign traffic spike. The connection pool broke first. The team had to add PgBouncer and read replicas within an hour. Connection overhead also takes up a lot of memory on a managed instance such as RDS db.r6g.xlarge with 32 GB RAM, where many active backends use multiple gigabytes before queries get any working memory.
What connection pooling actually fixes — and what it cannot
PgBouncer and Supavisor maintain a small set of persistent backend connections and multiplex client connections through them. This protects Postgres from spikes in client connections and from having to create processes over and over to handle them. PgBouncer’s transaction mode assigns a backend only for one transaction, then returns it to the pool. Thousands of clients can share a small backend pool. For short OLTP transactions, that reuse is genuinely powerful.
The formula (num_cpu_cores × 2) + 1 gives 9 connections for a 4-core instance as a starting estimate of pool size. The benchmarks in the notes show roughly 9× throughput with transaction-mode PgBouncer compared with direct Postgres connections, with the same client concurrency and the same hardware. Direct connections spend much of that test fighting max_connections. At extreme query rates, however, single-threaded PgBouncer can itself become the bottleneck.
For Supabase serverless workloads, the recommended first step is the pooler endpoint or PostgREST, which avoids persistent database connections from clients. Neither changes an analytical query’s backend occupancy. A handful of long-running transactions can tie up the whole backend pool and leave OLTP requests waiting. Session pooling also holds a connection for a session while it is idle, which makes it safe for reporting but wastes connections. The recommended pattern is a separate small session-mode pool for reporting and a transaction-mode pool for OLTP.
The network latency dimension that pooling benchmarks ignore
Client-side pools add another limit when application services are far from the database. The Postgres wire protocol is synchronous per connection, with one active in-flight query or transaction per channel. That channel remains occupied until the final row batch and ReadyForQuery return. Backend availability does not make the client socket available. A benchmark close to the database can therefore miss the constraint that governs a distributed application.
Consider a client-to-pooler WAN link of 30 ms and a pooler-to-Postgres internal LAN link below 2 ms. The database may execute a query in under a millisecond and the pooler recycle its backend in roughly 2 ms, yet the client socket remains occupied for the full 30+ ms round trip. Serverless functions amplify this mismatch by opening their own client connections. Hundreds of instances can use up client-side file descriptors and hit the pooler’s connection limit during a spike.
When tuning is enough and when workload separation becomes unavoidable
The decision should turn on the observed bottleneck. Pooling cuts connection overhead, while raising work_mem for analytical roles can give sorts more of the memory they need. Materialized views and partial indexes can reduce repeated aggregation work. Partitioning and covering indexes can reduce I/O amplification. These measures are legitimate remedies when they target the resource actually limiting execution.
When vacuum contention or table bloat persists, it shows that analytics is getting in the way of database maintenance. Large sequential reads that genuinely need most of a table cannot simply be indexed away. CPU-bound aggregations can also expose the limits of row-oriented execution even with sound query structure. When these workloads displace the buffer cache or consume backends enough to degrade OLTP latency, the production application is absorbing their cost.
Until those signals appear, another engine makes the system more complex and may bring no benefit. For datasets in the tens of gigabytes and dashboards that tolerate a second or two, a well-tuned read replica with materialized views can be sufficient. A replica isolates reporting from the primary but retains the same row-oriented engine and can still saturate. The traditional replica model also uses hardware matched to the primary’s OLTP peak, which can lead to over-provisioning. TimescaleDB’s continuous aggregates and time-series compression, and Citus’s parallel sharded scans, extend the Postgres-native options.
When separation is warranted, the recommended path is to move large scans and aggregations to separate analytical compute through change data capture. The replicated data should retain tenant_id. Postgres remains the source of truth, while the analytical system absorbs the workload that would otherwise compete with production transactions.
How monitoring connection and pool metrics gives you advance warning before the cliff
That decision requires connection-level evidence alongside CPU charts. A brief diagnostic query is SELECT count(*), state FROM pg_stat_activity GROUP BY state ORDER BY count DESC;. Hundreds of idle in transaction rows are a warning signal of pooling trouble. Continuous monitoring should distinguish active, idle, and idle-in-transaction connections and compare active connections with the pool limit. The age of the oldest connection and the time slow queries take show whether a few sessions are holding resources for too long.
Database CPU, memory, disk I/O, WAL growth, and replica lag provide the surrounding resource picture. Alerts need to precede full pool occupancy. A threshold at a meaningful fraction of max_connections leaves time to respond, whereas counts already crowding the limit indicate that the incident is starting. Idle connections older than a chosen threshold are candidates for termination, and PostgreSQL 14 and later supports idle_session_timeout for automation. Older versions require a cron job or monitoring system, while per-role and per-database CONNECTION LIMIT settings constrain any single analytical workload’s connection use.
Supabase Metrics API exposes monitoring-compatible time series for CPU, IO, WAL, connections, and query statistics. Supabase shipped a one-click Grafana Cloud integration in July 2026 that configures authentication, metric scraping, and pre-built dashboards from the Supabase Dashboard. The integration is available on any plan, including free. That provides a concrete instrumentation path for teams that otherwise see only application symptoms. Observability reveals the pressure, but it does not remove its cause.
Why pre-materializing metrics keeps analytical load off the connection pool entirely
Pre-materialization changes when and where the expensive work happens. Instead of running an aggregation whenever someone opens a dashboard, metrics are calculated on a schedule or trigger and written to governed datasets. Dashboards, reports, and agents then read pre-computed answers. The expensive scan is no longer a request-time dependency. When heavy aggregations run outside the production pool, demand from consumers does not directly add analytical connections that compete for it.
For Supabase teams choosing analytics and dashboard tools, this makes execution location a more useful criterion than direct connectivity alone. A direct Postgres connection provides access, but it does not isolate analytical load. A governed layer can connect to Supabase as the source of truth without making production Postgres the engine for every analytical question. Its data dictionary keeps one canonical metric definition, one source for the calculation, and a changelog. A founder, investor, support representative, and agent can then ask the same question without receiving incompatible numbers.
Agents make that distinction especially important because ad-hoc production SQL introduces connection pressure, security exposure, and inconsistent metric calculations. The recommended interface is read-only and token-efficient, serving pre-modeled datasets through an API or MCP without exposing production directly. Anthropic introduced the Model Context Protocol in late 2024 as a standardized interface for agents to interact with external tools and data. An MCP server can expose governed, pre-materialized results without opening production connections for those requests.