MCP Server Architecture Patterns That Turn a Supabase Schema Into a Live Agent-Queryable Analytics Endpoint
Raw table access won't give agents trustworthy answers; governed metrics will.
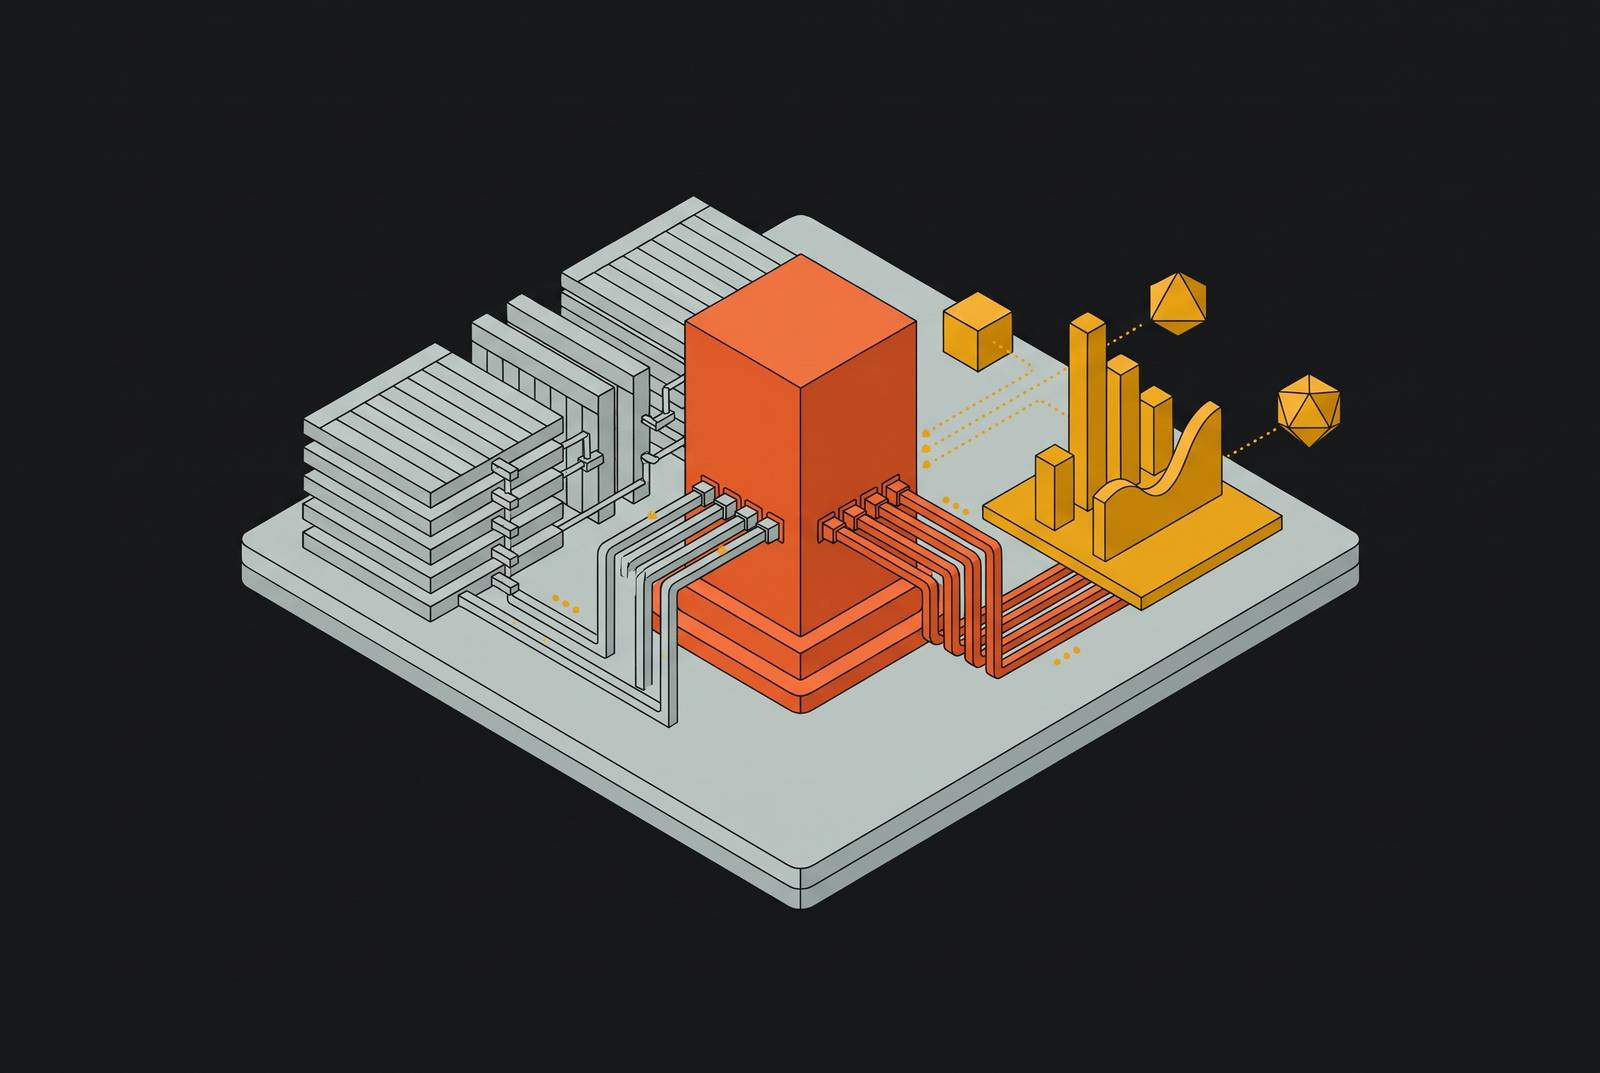
Analytics for Supabase teams requires more than an MCP connection to raw tables. A trustworthy agent-queryable endpoint combines read-only tools, an isolated analytical data path, shared metric definitions, and identity-scoped access, with observability across them.
Why wiring an MCP server to a Supabase schema is not the same as building an analytics endpoint
A schema tells an agent what tables, columns, and foreign keys there are. It does not explain what the business means by NRR. An agent writing SQL from that schema must infer which cohort window to use, which status codes to exclude, and which accounts count as internal. The query can run without errors and still answer the wrong question.
MCP standardizes tool calls through JSON-RPC messages over stdio or Streamable HTTP, but it does not define the correctness of a tool’s return value. That responsibility sits behind the interface. Atlan’s enterprise MCP guide distinguishes tool-access mechanics from the governed organizational context agents need to interpret data accurately. In an analytics endpoint, the domain and infrastructure layers must supply that missing foundation rather than leaving the agent to reconstruct business rules from database structure.
What the MCP architecture actually looks like when production-deployed against Supabase
A production MCP deployment has three distinct roles. The host is the AI-driven application, while the client is a component inside it that maintains one dedicated connection per MCP server. The server is the lightweight process exposing tools, resources, and prompts. These roles describe how an agent reaches a capability. They do not prescribe the business logic behind it.
Inside the server, four layers divide that work. The interface layer transports JSON-RPC messages through stdio for local connections or Streamable HTTP for remote connections. The application layer routes requests and runs authorization checks, and the domain layer has the business logic. The infrastructure layer connects to databases, warehouses, and SaaS systems through drivers and adapters. This separation allows transport changes, tighter authorization, or new integrations without rebuilding adjacent layers.
Supabase also supports an app-level MCP server deployed as an Edge Function. Each tool call runs under the authenticated user’s identity, and RLS policies govern what it can reach. Separately, the MCP specification version 2026-07-28 moved experimental Tasks out of the core protocol into an official async Tasks extension. Servers can return task handles unsolicited without per-request opt-in, a protocol capability distinct from the server’s data and authorization rules.
Why broad tool exposure is the first architectural mistake for analytics use cases
The first design error is treating every available Supabase capability as appropriate for an analytics agent. A developer assistant uses arbitrary SQL execution, schema management, and Edge Function deployment for its operational work. Analytics requires a narrower set of capabilities. An agent retrieving a governed metric does not need the tools that change the application producing that metric’s source data.
Broad exposure creates two different classes of failure. Write access can allow prompt injection or misconfigured scope to redirect an agent into modifying production data. Read-only access to arbitrary SQL prevents that write risk, but still lets the agent make up business calculations. Security and accuracy need separate controls. Restricting writes does not certify a formula, and certifying a formula does not authorize every user to retrieve its result.
For analytics endpoints, the appropriate tool surface is a small, stable set including get_metric, list_metrics, and get_dataset. Each tool exposes only a defined analytical capability. MCP’s specification recognizes explicit tool scoping as a design-level security concern. The practical boundary is minimal scope consent, in which agents access only designated context and use it only in defined ways. Broader access may let an agent do more, but exploratory queries belong on a separate surface, outside the path that is meant to return trusted KPIs.
How do you get analytics and dashboards for your Supabase project without querying production?
The analytical read path must be isolated from the production write path. Supabase’s Postgres stores project state including user data, auth sessions, Realtime metadata, and storage metadata. When large reporting scans and live transactional writes use the primary database, they compete for the same connection pool and I/O budget. Read-only does not mean operationally harmless. Expensive queries can cause timeouts or degrade write latency for application users.
Supabase supports read replicas for dashboards and reporting that do not require immediate write consistency. Routing the MCP server’s infrastructure layer to a replica is the minimum viable separation. Materialized views cut down on repeated work by pre-computing aggregations so that each agent request does not have to scan base tables. These controls address different costs.
A separate analytical store extends that separation beyond replica routing. Supabase Pipelines, in Public Alpha in 2026, supports BigQuery, ClickHouse, Snowflake, and DuckLake destinations in public alpha. It can detect supported source-schema changes, including adding, removing, and renaming columns, and apply them to destinations automatically. The qualification “supported” is important to that capability. For teams replicating Postgres data into an analytical store, this reduces the manual work involved in keeping destination schemas aligned.
RLS serves a different purpose from workload isolation. It determines which rows an identity can see. A dashboard connection or MCP connection that respects RLS can still burden production if it runs expensive analytical queries against the primary. For Supabase analytics and dashboards, the relevant architectural criteria are therefore the query destination, the pre-computation strategy, and the required write consistency.
The semantic layer as the domain layer of an analytics MCP server
The semantic layer sits in the server’s domain layer and defines what each metric means. Revenue, Churn, CAC, and NRR each receive one definition expressed as code rather than separate formulas scattered across dashboard queries. The MCP tool invokes that definition instead of asking the agent to generate SQL from raw schema information. The calculation becomes part of the endpoint’s governed contract.
Consider the NRR question that raw table access leaves unresolved. Without a semantic layer, an agent must derive the cohort window, status-code exclusions, and account filters from column names and schema comments. Different phrasings can lead it toward different calculations, producing metric hallucinations despite valid SQL. With a semantic layer, the agent calls get_metric, selecting nrr and the period this_quarter. The domain layer applies the defined cohort, exclusions, and filters.
This changes where analytical judgment takes place. Business rules are established in the metric definition before a request arrives, while the agent selects the metric and its permitted parameters. Correctness still depends on defining that metric correctly. The architectural gain is that a business rule can be governed in one place instead of being improvised during every conversation. Pre-modeled datasets and pre-calculated results give those definitions a controlled data surface to operate on.
A dashboard displaying NRR and an agent preparing a weekly report can use the same predefined calculation. Their agreement then comes from a shared definition. This is a concrete criterion for evaluating analytics tools that connect to Supabase.
A semantic layer’s coverage is limited to its modeled questions. The governed endpoint handles the questions that come up often and drive decisions, and a separate exploratory surface handles questions outside the modeled set. Extending coverage means adding a governed metric definition.
Identity, scoped tokens, and what governs which agent can read which metric
A certified metric is not automatically appropriate for every caller. Authorization must bind access to the person and tenant represented by the request. Agent A may be allowed to get revenue for a user’s own tenant but barred from reading another tenant’s data. The token must express that boundary. The application layer then checks it before returning a metric.
Supabase’s Enterprise-Managed Auth for MCP provides a concrete identity-governance pattern. It allows companies to control MCP connections through their own identity provider, starting with Okta, with each token bound to the member who signs in. Claude can also issue identity assertions for organizations whose IdP does not support the MCP extension. The governing principle is centralized issuance and member-bound access rather than disconnected per-user authorization flows that bypass enterprise policy.
Supabase’s MCP Elicitations feature requests explicit user confirmation before high-impact operations such as creating a paid project or running SQL that could delete data. Supabase acknowledges that confirmation is not a guarantee. A narrowly scoped analytics endpoint excludes those operational tools, while any non-read operation outside that boundary requires explicit confirmation. Audit logging records tool-call inputs, outputs, and policy decisions so that a scope error has an inspectable trail rather than remaining hidden until a breach or a disputed board-meeting number exposes it.
Observability on the MCP and Postgres layers before agents go to production
Agents and people using dashboards differ in how often they send requests, which metrics they ask for, and when they ask. A p95 latency that works for human users may cause timeouts under agent load. To be ready for that load, teams need to see what happens at both the MCP and database layers. Identifying the cause of a slow response requires connecting it to the tool call, its query behavior, and the resources consumed downstream.
Supabase’s Metrics API exposes Postgres performance and health metrics in Prometheus exposition format. Those metrics help teams see from the database side when analytical workloads compete with transactional writes even though they were meant to be kept apart. A latency spike on an analytical query is both a dashboard performance issue and a warning to check the load boundary. If analytical scans are reaching the primary, production is exposed. Database telemetry makes that architectural failure visible.
pg_stat_statements, enabled by default on most managed Postgres, records query mean time, total time, and call count. It is a starting point for identifying expensive agent-driven queries and investigating whether they use the right indexes. Protocol logs need to record each MCP tool call’s input parameters, response time, and an indication of whether the semantic layer served a predefined metric or fell through to ad-hoc SQL. That fallback signals a missing metric definition and warrants an alert, because it crosses the boundary between governed retrieval and improvised analytics.
Putting the four patterns together: what a governed Supabase analytics endpoint actually looks like
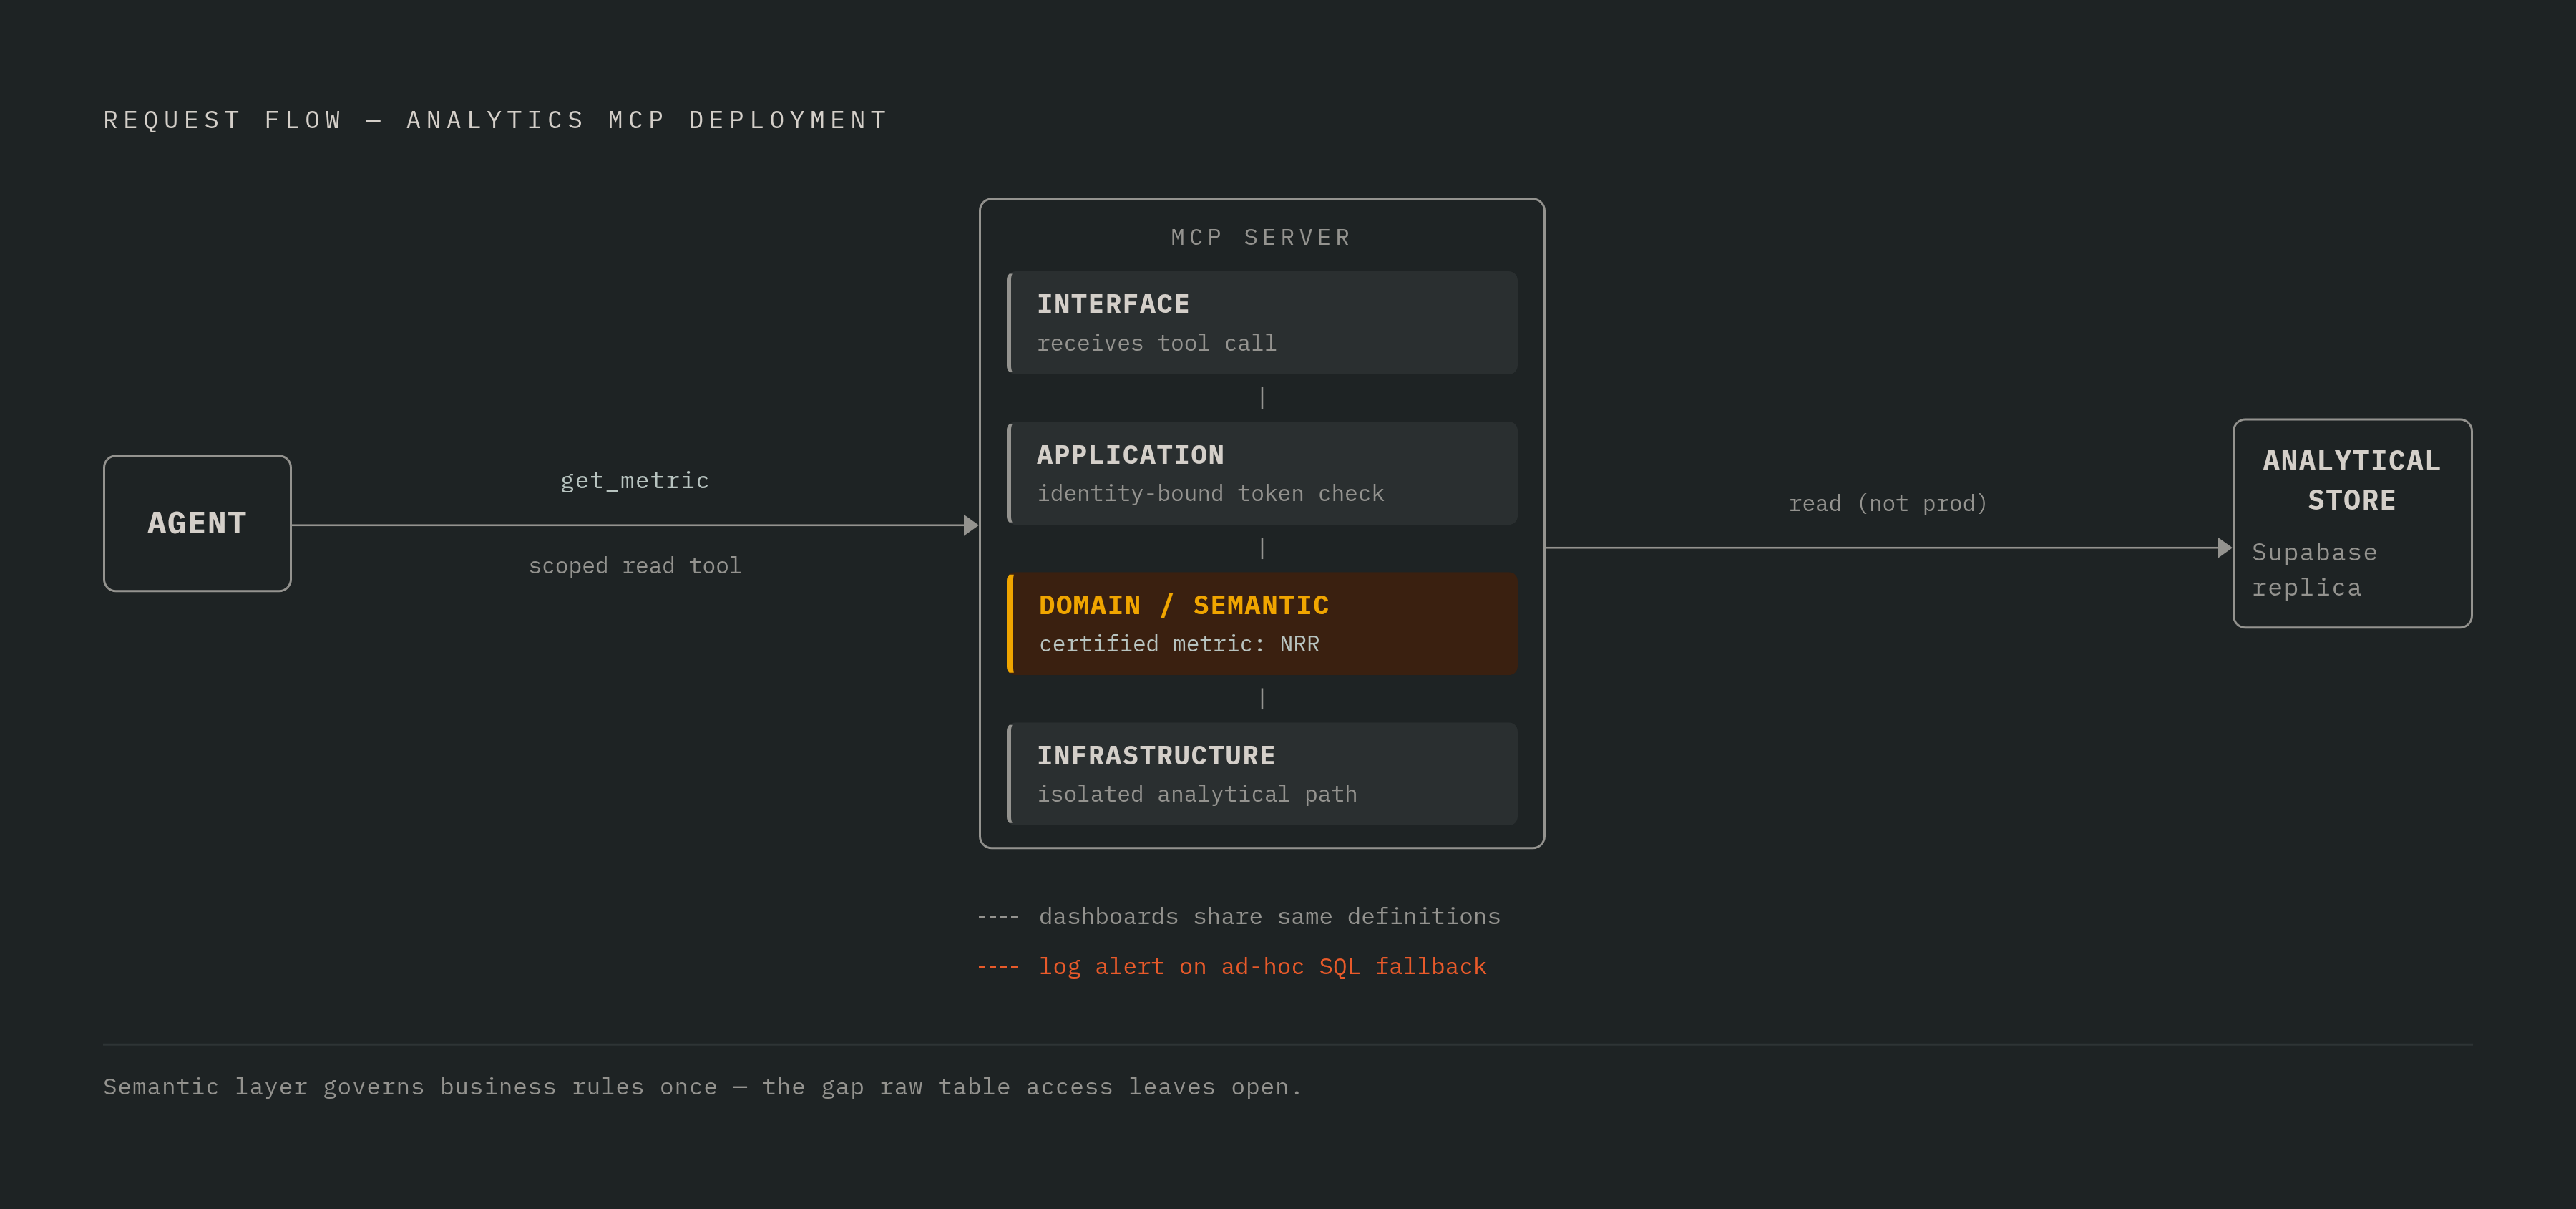
Tool scope limits what the agent can request, the data path isolates analytical work, the semantic model defines the answer, and identity determines who may receive it. Observability spans all four. Each boundary addresses a failure that the others cannot prevent, so removing one leaves a specific gap even when the remaining controls work.
A diagram of this architecture would place the agent first, followed by the MCP server, the semantic layer, the analytical store, and the Supabase replica supplying the analytical data path. The arrows show where requests go and where the data comes from. The agent requests a metric through a read-oriented tool, the server validates its scoped identity, and the domain layer resolves the request against a certified definition. The infrastructure layer reaches the isolated analytical data. Where a supported analytical destination is used, Pipelines maintains the replicated data path.
Human dashboards consume those same metric definitions, while tool-call logs and database metrics expose how the endpoint behaves under load. An alert on ad-hoc SQL fallback protects the distinction between modeled answers and exploration. The resulting endpoint can return the same NRR number to an agent and a dashboard without granting production writes or cross-tenant reads.