One Metric,Long read
Why Self-Service Analytics Creates More Metric Disagreements
Giving everyone data access without shared definitions multiplies conflicting numbers.
· 10 min read
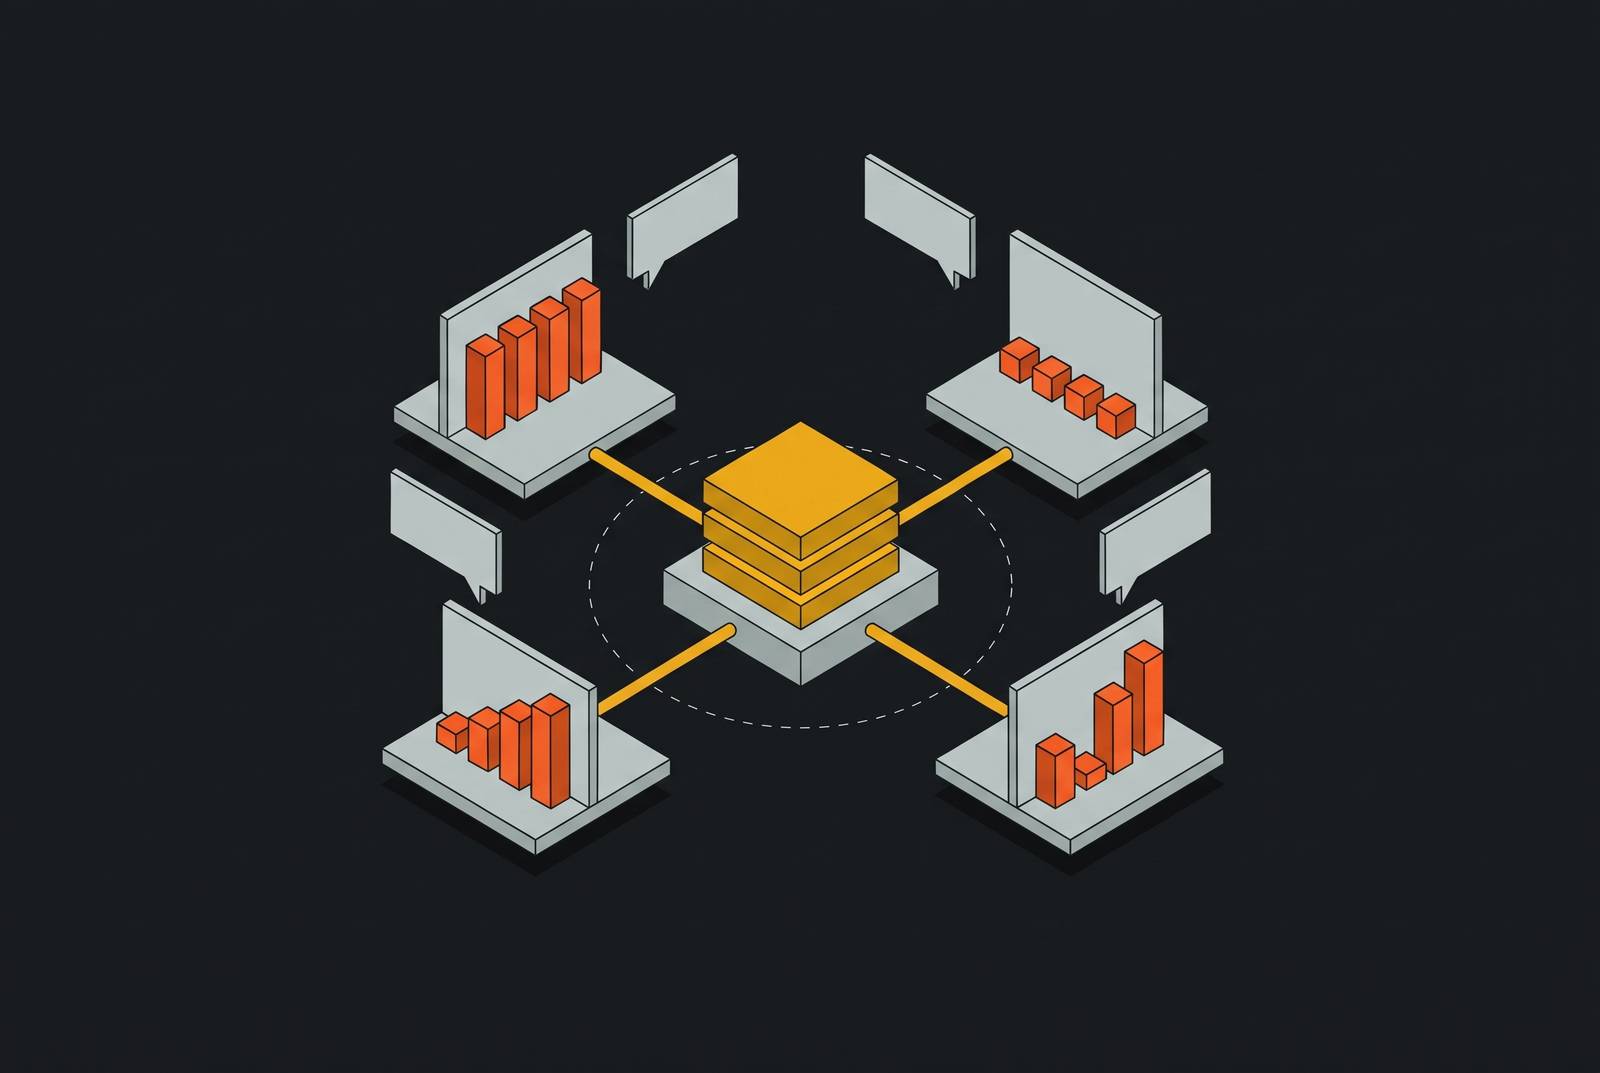
Why self-service analytics produces more disagreements, not fewer
- Role: Opens the argument by naming the structural paradox — more access, more conflict — so every section that follows is a consequence or a remedy of this one mechanism.
- Self-service analytics multiplies metric disagreements because it distributes the power to query data without distributing agreed-upon definitions of what that data means.
- The tool changes who can run queries, not what the data means — so if joins, grain, and metric definitions are unsettled, business users produce wrong answers confidently
- The mechanism is structural, not behavioral: ungoverned access turns a governance problem into a proliferation problem
- Classic illustration: churn — marketing counts subscription cancellations, finance counts revenue loss, customer success counts net revenue retention (NRR), which incorporates but is not the same as churn; all three teams present conflicting metrics in leadership meetings and nobody knows which version is correct
- Same pattern with ROI: marketing calculates (revenue minus spend) divided by spend; finance calculates revenue minus COGS divided by spend — same data source, two irreconcilable numbers
- Note: Open on the board-meeting moment — two executives, same data source, different revenue figures — to make the cost of the problem visceral before naming the mechanism. Keep this section tight; the detail belongs in later sections.
How dashboard sprawl and shadow BI follow from ungoverned access
- Role: Moves from the abstract mechanism to its concrete downstream symptoms, showing the reader what the proliferation problem actually looks like inside an organization before pivoting to trust erosion.
- Once ungoverned self-service spreads, the organization accumulates dashboards, shadow exports, and unauditable answers faster than any team can reconcile them.
- Dashboard sprawl: a SaaS company found that 60% of their dashboards used inconsistent revenue definitions — some excluding refunds, others including deferred revenue, others using bookings — requiring a multi-month remediation project that involved deprecating and rebuilding from governed metrics
- Shadow BI emerges when a finance analyst exports to a spreadsheet because approval takes three days; the company now has an ungoverned copy of regulated data on a laptop
- Unauditable answers: someone asked an AI tool a question in a chat window months ago, the number is in a board deck, and the query is gone — no lineage, no reproducibility
- Domo's self-service analytics guide identifies metric inconsistency, dashboard sprawl, and security gaps as the predictable failure patterns — and notes that data quality issues surface after decisions are made, not before
- Note: Keep the SaaS remediation story concrete but brief — it's an example, not the point. The point is that these symptoms are structural consequences of skipping governance, not isolated incidents. End the section on trust erosion to set up the next section.
Why low adoption persists even after the tool improves
- Role: Sharpens the argument by showing that the industry's conventional fix — better interfaces, more seats — has not worked, which forces the reader toward the governance explanation.
- BI adoption has remained stubbornly low for well over a decade despite successive generations of easier tools, which points to the trustworthiness of underlying data as the real constraint, not the interface.
- Promethium's self-service analytics guide describes the pattern precisely: organizations get stuck between IT-mediated reporting and ungoverned chaos — over-governing creates tools so restricted they are barely more accessible than IT tickets; under-governing creates ungoverned playgrounds where every team calculates revenue differently
- The failure is one of governance sequencing: Improvado's 2026 BI trends guide notes that self-service analytics has a 45% failure rate at smaller companies than large enterprises, and lists cloud BI plus governance as the prerequisite — not the tool itself
- More BI licenses on un-governed data make the bottleneck worse, because now more people produce more conflicting numbers — the data team is now fielding "why do these two numbers disagree" on top of the original ticket queue
- Note: Do not cite specific percentages from any source. Use directional language: "substantially higher failure rate at smaller companies." The argument here is that the interface is not the lever — governance is. Close the section on this claim so the next section can define what governance actually requires.
What governed self-service actually requires — and what most rollouts skip
- Role: Pivots from diagnosis to the structural remedy, establishing the three-part foundation that makes self-service safe — so the reader understands the fix is architectural, not procedural.
- Governed self-service needs three things that most rollouts never build: a certified metric layer, enforced access controls, and a clear ownership model — and the sequence matters.
- One certified metric layer: every view reads the same definition of revenue, active customer, or churn, so the portal cannot produce two answers to the same question — this is the metric definition problem solved at the source, not the dashboard
- Domo's guide frames governance as three pillars: a semantic layer as a single source of truth for metric definitions, a data catalog with descriptions, owners, and certification status, and role-based and row-level security access controls
- Ownership is non-negotiable: one person owns the metric definitions and is the final arbiter of what "CAC" means — without this, definitional drift returns within weeks
- Retrofitting governance after hundreds of ungoverned reports exist is expensive and frustrating; the right sequencing rule is to establish governance frameworks before implementing self-service access
- What governance changes for the data team: instead of filling ad-hoc requests, the team owns the certified metric layer, the access model, and the standards — self-service frees them from the ticket queue to do foundational work
- Note: The Community Health Network example comes from a context-only source; frame it as an illustration of the pattern without attributing it to a named third-party publication. Keep the section focused on the three-part structure — do not get into tooling specifics here.
How AI agents make ungoverned metric definitions a faster, larger problem
- Role: Introduces the agentic dimension — the argument's escalation point — showing that the same governance failure that causes human metric disagreements becomes qualitatively worse when agents query at machine speed and scale.
- AI agents amplify every self-service governance failure because they inherit whatever definitions are in the data layer and act on them at machine speed, with no human to notice the discrepancy before a decision is made.
- An agent does not pause to ask which definition of revenue to use — it inherits whatever is in the layer it queries, so an ungoverned layer produces authoritative-looking wrong answers at scale
- Agents can chain individually permitted queries to reconstruct an aggregate that no single query would return, so per-request permission checks alone do not cover the risk — the context layer has to account for that pattern
- The safe pattern moves from session-level access to attribute-based access control: row-level security returns only the records an agent is authorized to see; column-level masking redacts sensitive fields even from permitted queries — a fraud detection agent can see transaction amounts and timestamps without seeing payment card numbers
- Meta's warehouse agentic system introduced a "data-access budget": employees are given a budget based on the amount of data they typically access, refreshed daily, as a first line of defense against agent malfunctions or attacks
- The principle: a data store organizes data for people to query; agentic data infrastructure adds a governed access layer, a grounding layer encoding business definitions, and reusable data products on top — governance is not optional when agents are in the loop
- Note: Keep Meta's example brief and accurate to what the source says — do not extrapolate beyond the data-access budget framing. The escalation point is that agents make the human-scale problem a machine-scale problem; the section should land on that, not on agent architecture in depth.
Why MCP connectivity does not solve the metric governance problem on its own
- Role: Addresses the reader who believes that a modern integration protocol resolves the disagreement problem — and clarifies that transport and definition are separate problems, setting up the governed layer as the missing piece.
- The Model Context Protocol gives agents a standardized way to reach data sources, but a fast, uniform connection to ungoverned metrics is still a fast, uniform connection to the wrong answer.
- MCP, introduced by Anthropic in November 2024, addresses the N×M integration problem: without a shared standard, each combination of AI model and external tool requires a bespoke connector; MCP replaces that with a uniform interface
- The July 2026 MCP spec revision dropped session state for a stateless core, enabling horizontal scaling and standard HTTP routing — architecturally, the protocol is maturing
- But MCP is a transport protocol, not a semantic layer: it provides data access; it does not define what data means — metrics, entities, relationships, and governance policies live in the semantic layer, not in the protocol
- A security caution from the U.S. National Security Agency in a May 2026 report: MCP's rapid proliferation has outpaced the development of its security model — connectivity at scale without governance is not a solved problem
- The right architecture exposes a governed semantic layer through MCP, not raw tables — so agents get fast, uniform access to pre-modeled, permission-controlled answers, not to ungoverned query surfaces
- Note: Frame MCP as a genuine architectural advance, not a problem — the point is that it solves integration complexity but not definitional drift. The section should leave the reader understanding that protocol and governance are complementary, not substitutes.
Why Postgres-on-Supabase teams hit the metric disagreement problem earlier than they expect
- Role: Grounds the argument in the specific technical context of the target reader — Supabase builders — showing why the governance problem surfaces fast and why production Postgres is the wrong place to run governed analytics.
- Supabase teams tend to reach the metric disagreement problem early because the first real analytics questions cross multiple systems — billing, product, ad platforms — and Postgres was never designed to be the place those questions get answered safely.
- Postgres will execute any aggregation thrown at it — but pointing a BI tool at the production database means inheriting RLS friction, pooler limits, JSONB-hostile charting, and analytical load on OLTP compute, and the fixes show up on the Supabase bill
- The first real analytics questions most founders face — revenue by signup cohort, CAC against usage, which flagged accounts churned — cross Supabase, Stripe, ad platforms, and a CRM in a single sentence; those cannot be answered cleanly from one production Postgres instance
- One engineer writes SUM(revenue) and another writes SUM(amount_captured) — Q2 revenue differs, and nobody notices until an investor asks for audited numbers; the drift is insidious precisely because Postgres runs both queries without complaint
- Supabase published enhanced documentation for its Metrics API in December 2025: every project exposes a Prometheus-compatible endpoint surfacing roughly 200 Postgres performance and health series, scrape-able into any observability stack — observability infrastructure exists from day one, but analytical governance does not appear automatically alongside it
- Note: Do not frame Supabase negatively — it is the platform these builders have chosen and the right starting point. The argument is that production Postgres is the right operational database and the wrong analytical layer. End on the gap between what Supabase gives you out of the box and what a governed analytical layer adds.
What a governed metric layer looks like for a Supabase team that does not have a data team
- The architectural answer for Supabase teams is to pre-model metrics into a governed layer that sits alongside — not inside — the production database, so every downstream tool and every agent pulls from the same pre-calculated answer.
- The recommended path: replicate Postgres into a DuckDB-shaped, Iceberg-compatible analytical store, define metrics once on top, and point dashboards, AI, and APIs at that governed layer — no ETL complexity, no schema changes to the production database, no new OLTP load
- Pre-calculated metrics solve the SUM(revenue) vs SUM(amount_captured) problem at the source: the metric is computed once, with its definition owned and documented, and every consumer — human or agent — reads the same number
- Metrics pushed to where people work — inbox, Slack, dashboards — rather than pulled on demand by whoever remembers to check: this eliminates the version-proliferation pattern where each team runs its own query on its own schedule and arrives at its own answer
- Exposing the governed layer through a single MCP server means agents never touch the production database: they query pre-modeled Parquet datasets via DuckDB, getting fast, accurate, cheap-to-query context with no risk of reconstructing sensitive aggregates from raw tables
The sequencing founders should follow to get from ungoverned queries to a trusted metric layer
- Role: Closes the argument with a practical, ordered path forward — converting the diagnosis and the remedy into steps a founder or small team can act on, so the piece ends with direction rather than abstraction.
- Getting from ungoverned self-service to a trusted metric layer is a sequencing problem, not a tooling problem — the order of operations matters more than the sophistication of the stack.
- Step one: define the metrics that actually drive decisions before building any dashboard — assign a single owner for each, write down the definition, and treat it as the source of truth even if the implementation is still scrappy
- Step two: separate the analytical layer from the production database — even a minimal DuckDB setup that reads from Postgres without writing to it is safer than pointing BI tools directly at the OLTP instance
- Step three: establish observability on the production database from day one — Supabase's Prometheus-compatible Metrics API surfaces the data needed to catch performance problems before analytical load causes them; pg_stat_statements and auto_explain enabled, one alert per key item, a quarterly review of the top queries covers most of the value at minimal cost
- Step four: before adding agents to any data workflow, confirm the layer they will query is governed — pre-modeled datasets with column-level controls, not raw table access through a broad connection string
- The goal is one governed layer that humans and agents both read from: not a patchwork of per-team queries, per-tool connections, and per-agent permissions, but a single set of numbers every stakeholder — and every workflow — stays aligned on
Filed underOne Metric,