Agentic Orchestration Patterns That Let a Solo Supabase Founder Skip the Analytics Hire
Agents on a governed data copy can replace a solo founder's analyst.
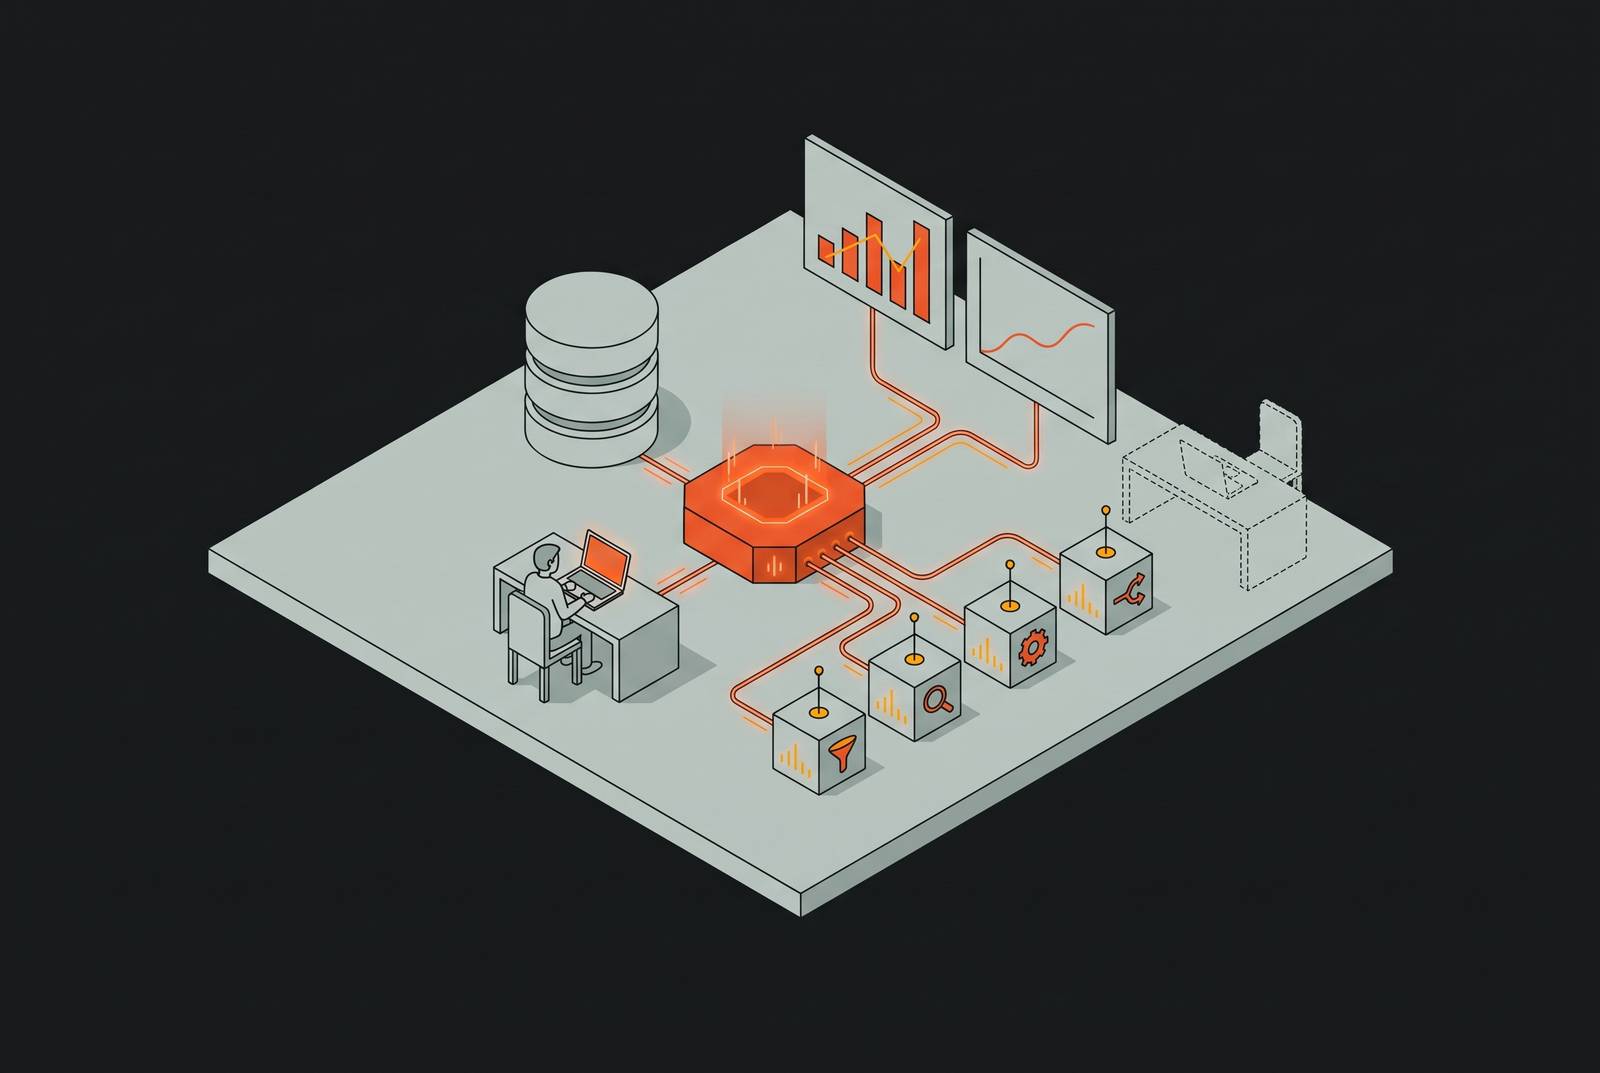
Analytics for Supabase teams can run on a governed analytical copy rather than the production database, with agents handling anomaly detection, metric delivery, and recurring questions. This lets a solo founder skip the analytics hire rather than merely postpone it, while retaining business judgment. The essential investment is shared metric definitions and controlled data access.
Why solo founders are skipping the analytics hire now, not later
A solo Supabase founder is stretched thin. Daily metric checks compete with product development, support, and sales, while an analytics hire is difficult to justify at this stage. As more people found companies alone, that gap becomes a problem with how the work gets done. That work still has to happen every day. What has changed is the infrastructure available to perform it.
Agents can now handle work that repeats, such as scheduling, support triage, content, and data analysis. In analytics, that means pulling morning metrics, detecting deviations, and surfacing results that otherwise require dedicated dashboard time. LangGraph 1.0, released October 2025, has roughly 400 companies running it in production, so orchestration has moved past the experimental stage. But agents that run well can still get the analysis wrong. Agents can hallucinate or misread data, and the architecture must address these risks where definitions and access are controlled.
What the analytics hire actually does, and which parts agents can cover
The analytics function is a bundle of tasks: pulling daily and weekly metrics, building and maintaining dashboards, writing anomaly reports, answering ad-hoc questions, and keeping definitions consistent. Agents can cover morning pulls, anomaly detection, digest delivery, and recurring questions against governed datasets. Judgment remains with the founder. Choosing metrics, interpreting an anomaly in business context, and making product or pricing decisions are separate from producing the numbers.
The minimum viable KPI set is small enough to make this division concrete. MRR/ARR is the primary scoreboard, while new paying customers per month is the leading indicator of MRR. Top-of-funnel organic traffic and signups describe acquisition. Activation rate measures the percentage of signups reaching the “aha” moment in their first session, with a rate below roughly a third signaling broken onboarding. Logo churn above roughly one-in-twenty per month is a sign that product-market fit is broken.
An agent does not need to invent a new analysis each morning to report whether activation or churn has changed. It does need a stable definition of each measure. When sales, finance, and product maintain separate versions of ARR, reporting becomes an argument about numbers. Even a scrappy single-source setup avoids that fragmentation, but agents need those shared definitions expressed in governed datasets.
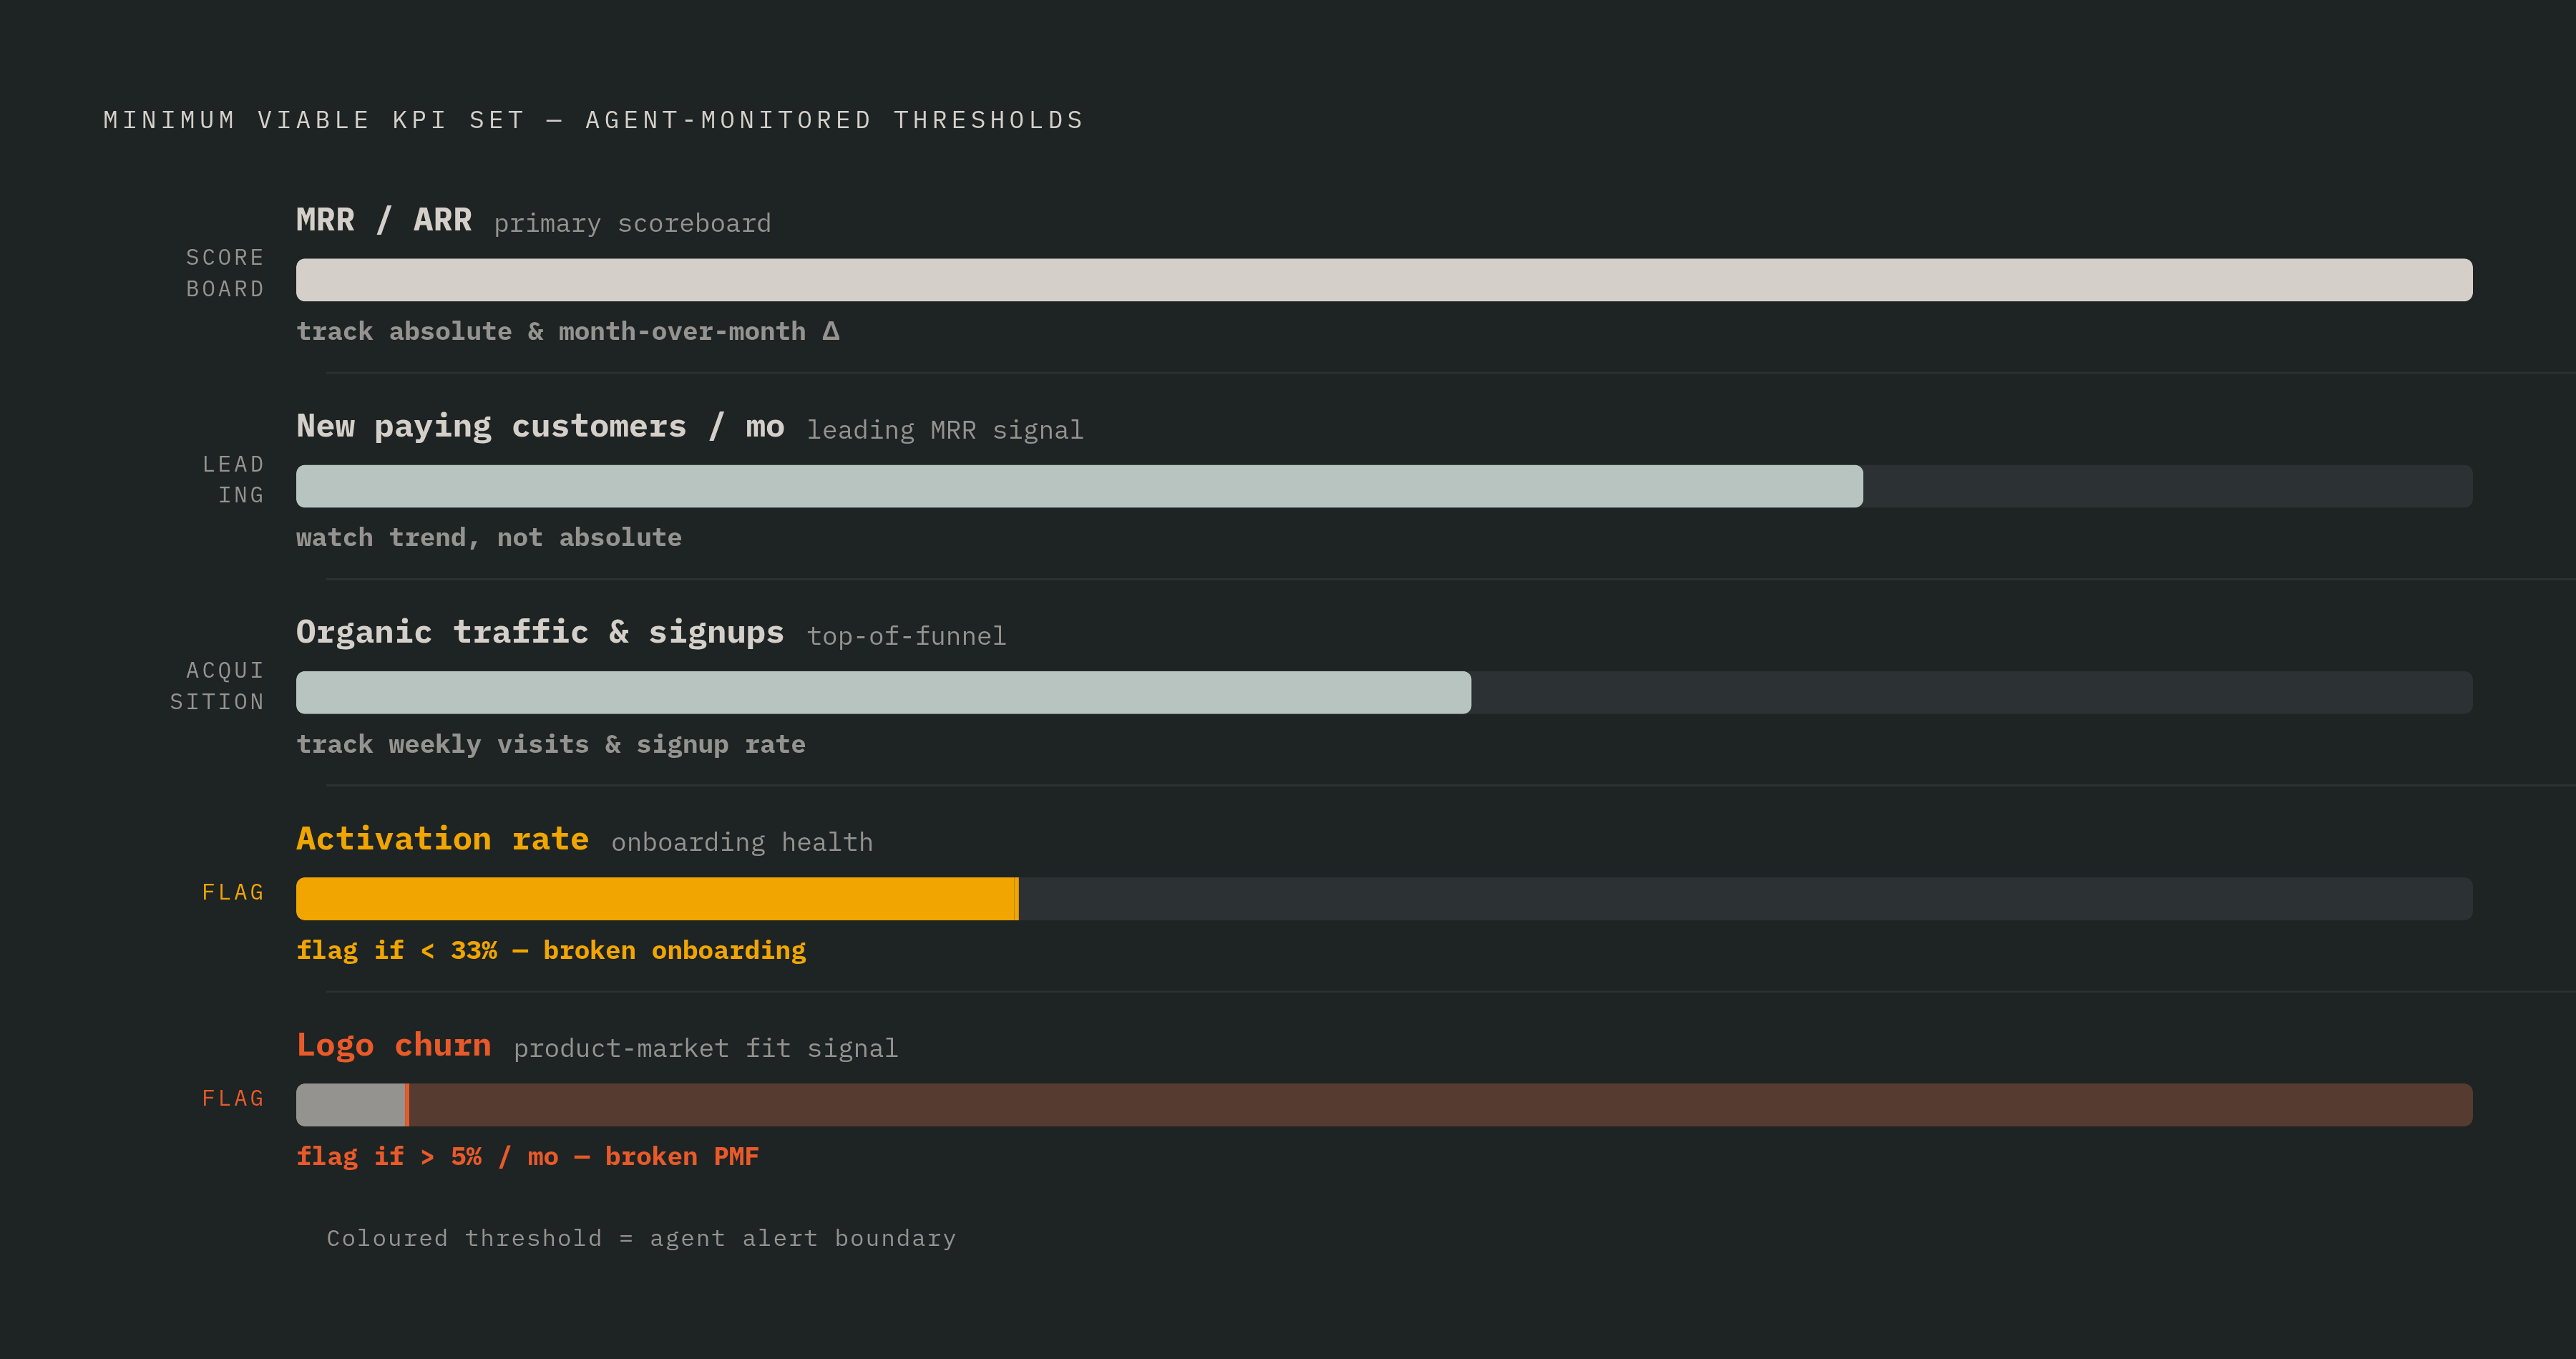
Why pointing agents — or dashboards — directly at a Supabase Postgres instance breaks things
The first failure may appear on the Supabase bill. Postgres will execute aggregation queries, but a Supabase Postgres instance is an OLTP database serving the application. Analytical scans consume that same compute and can degrade app performance as demand grows. Query success is not evidence of workload suitability. JSONB columns common in Supabase schemas add another difficulty because charting tools and analytical aggregation do not handle them naturally.
Supavisor’s transaction mode is built for short-lived connections and does not support prepared statements, which BI tools rely on. Session mode or a direct connection works, but holds long-lived connections against the database serving the app. Direct agent queries risk exhausting the connection pool because agents do not respect connection budgets the way a human using a dashboard does.
Direct access also creates permission-boundary problems at the production database. The NSA flagged in May 2026 that MCP’s rapid proliferation had outpaced its security model, with a scan of publicly reachable MCP servers finding a large share without authentication. An exposed interface is not a governed interface. Without p50/p95 latency dashboards and pg_stat_statements tracking, the resulting analytical load can also degrade app performance before the founder understands the cause.
How do you get analytics and dashboards for your Supabase project through a governed data layer?
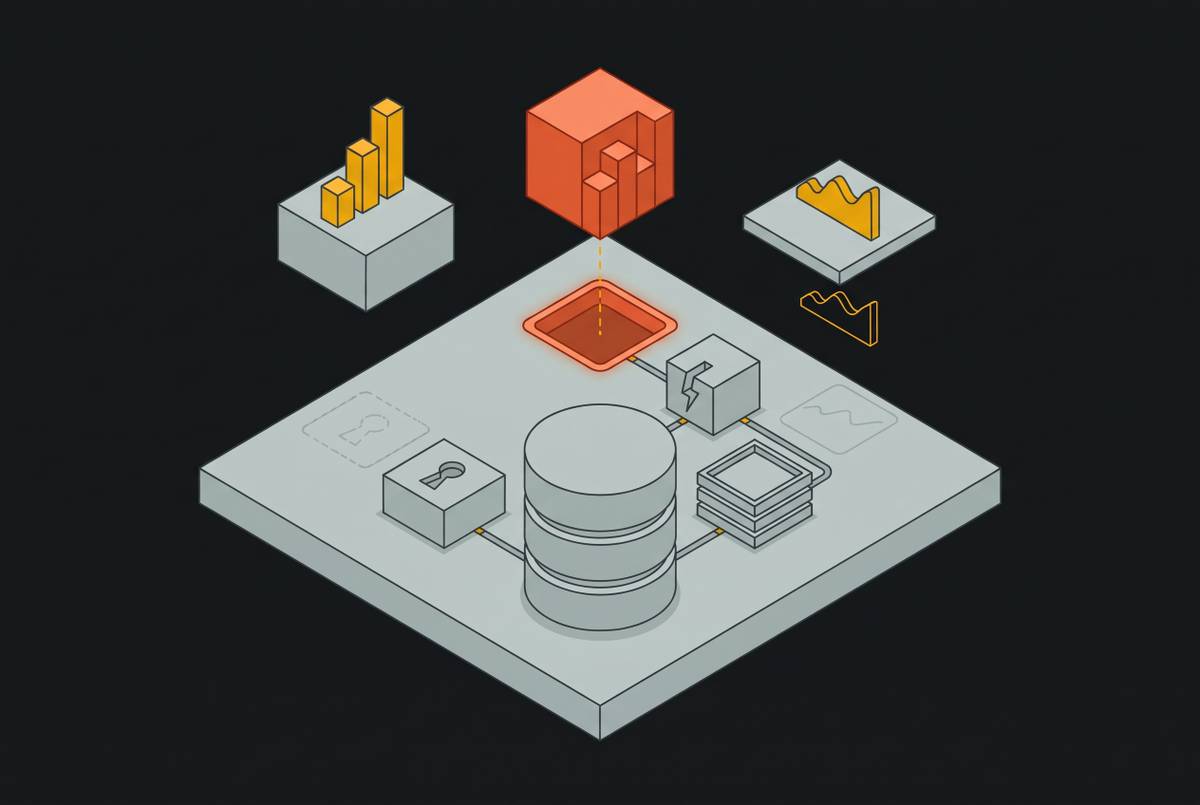
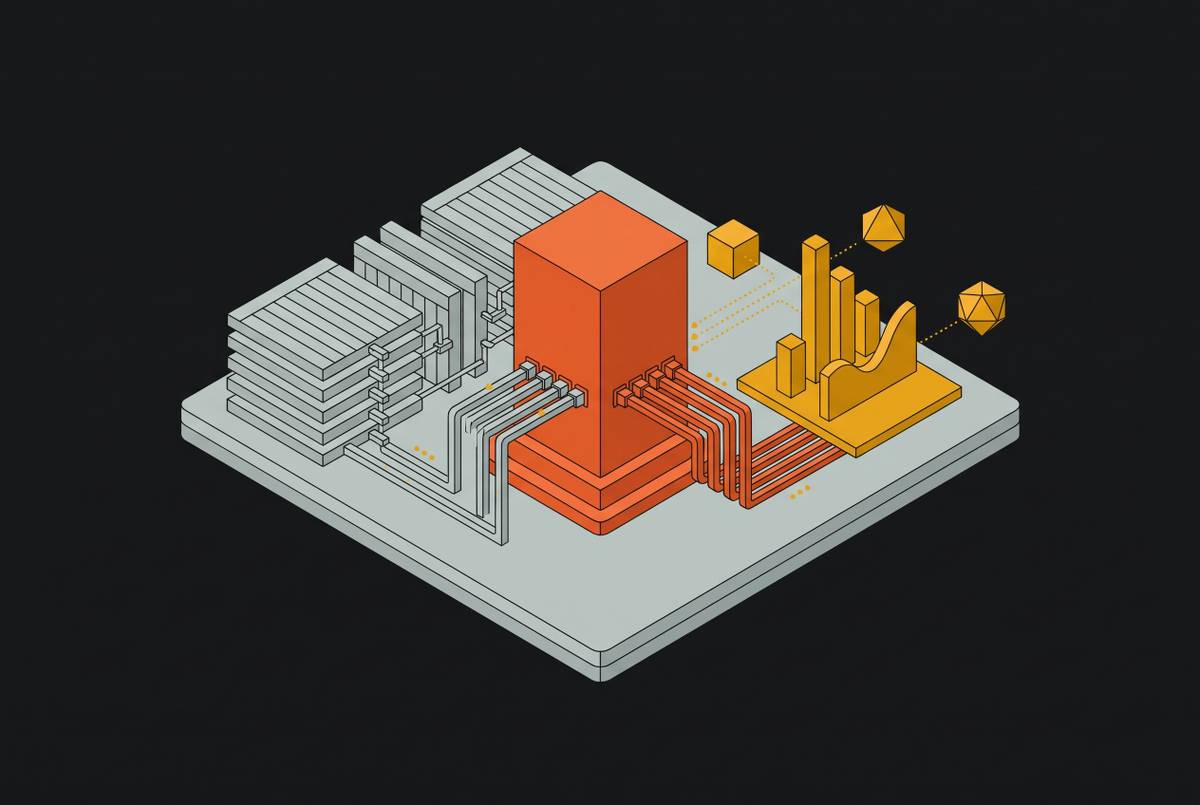
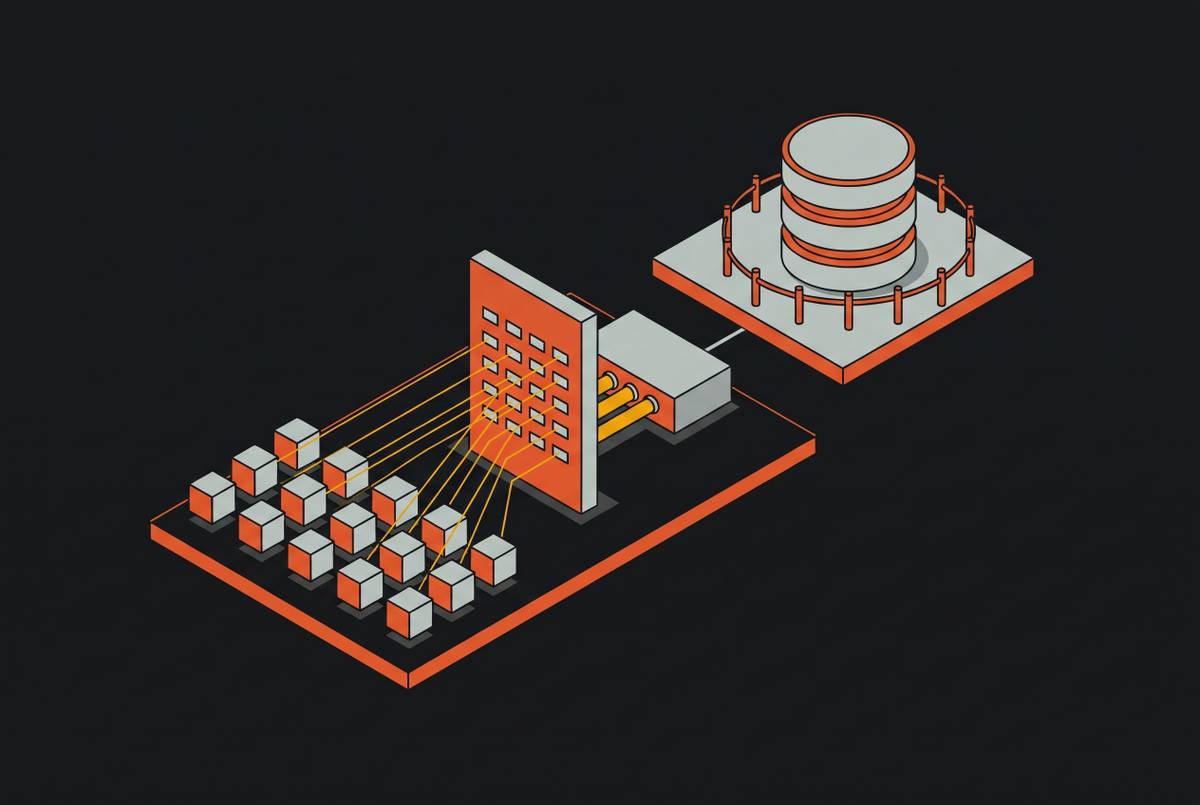
A governed analytical copy sits between Postgres and everyone who uses the data. It contains pre-calculated metrics materialized into Parquet datasets, queryable through DuckDB and exposed through a single MCP server. The layer reads from Postgres when preparing that copy, rather than querying production when someone requests analytics. This distinction removes analytics-time pressure from the transactional instance. The replacement for the analyst’s reporting work is therefore infrastructure.
Pre-modeling also establishes where metric definitions live. A query against raw tables returns what the current schema contains, while a governed dataset represents what the team has agreed a metric means. Humans and agents both use that same calculation. Parquet and DuckDB make this context fast and cheap to query without production connection-pool pressure. For a founder choosing a BI front end, compatibility with this governed layer is more useful than direct connectivity alone.
The analytical copy itself must have rules for who can access it. Production RLS policies do not follow data when it leaves Postgres, so copying data without scoped permissions leaves a new security gap. MCP’s primitives provide distinct interfaces to the governed layer. Tools execute operations such as metric queries, Resources provide schemas and governed datasets, and Prompts supply reusable workflow templates.
Discovery should remain compact rather than exposing every underlying operation at once. A small façade of search, payload examples, and execute gives agents a narrower interface, while stable capability descriptions can be cached. Search must be constrained to the user’s role. Every selected operation, payload shape, identity, and result status should be logged. This makes access scope and auditability part of the data path rather than obligations left to each individual workflow.
Three agentic orchestration patterns a solo founder can wire to that data layer today
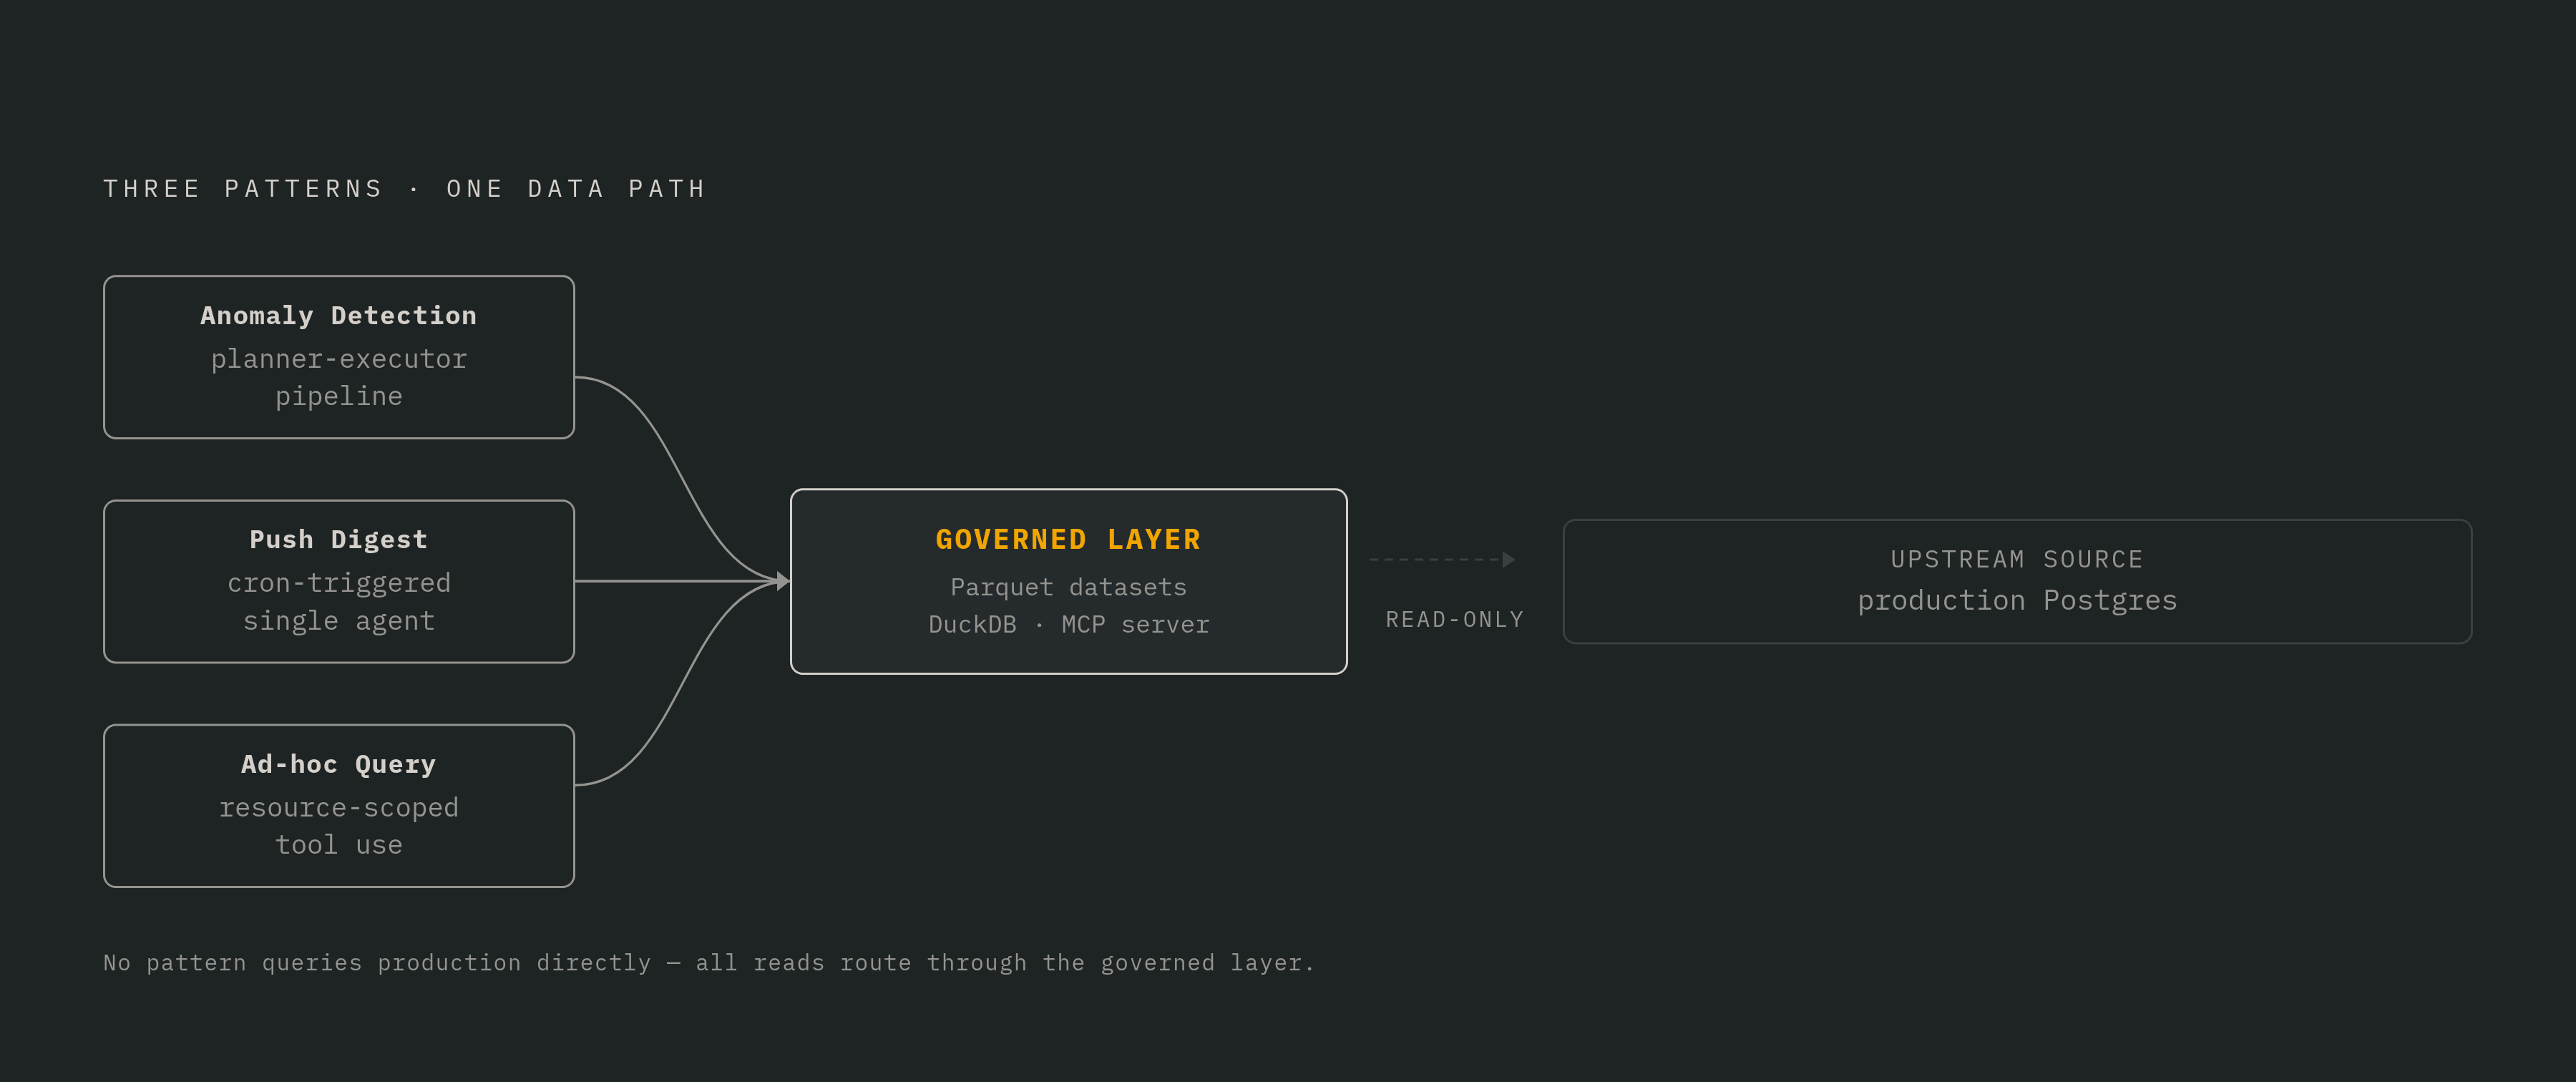
Pattern 1 is morning anomaly detection using a planner-executor pipeline. Each morning, a planner agent reads pre-calculated metric snapshots and identifies deviations from their baseline. An executor formats and routes the findings, sending anomalies above a threshold to Slack or email while logging routine results silently. Quality gates at each stage keep notifications focused on findings the founder needs to see.
The governed layer is the dependency that stabilizes detection. The agent must compare the snapshots against the pre-calculated baseline, never re-derive a metric from scratch. Otherwise, a changed schema or query timing artifact can look like a business anomaly. The founder still decides whether a flagged change comes from a product problem, a pricing decision, or something else in the business.
Pattern 2 is push-based metric delivery using a scheduled single-agent workflow. A cron-triggered agent reads governed Parquet datasets through a single MCP resource call and uses a template prompt to compose a digest. Its cadence can be daily, weekly, or end-of-sprint. The digest covers MRR movement, activation rate, churn flags, and top-of-funnel signals, delivered to the inbox, Slack, or phone. Metrics arrive where the founder already works.
Push delivery removes the need to remember a dashboard login, making reporting part of the founder’s daily rhythm. The orchestration itself remains deliberately small and predictable. Consistency comes from the governed calculation, so Monday’s digest and an investor update do not use separate definitions of MRR. Morning anomaly detection can feed the same digest. The two workflows share data, so each can use the same reporting logic.
Pattern 3 is agent-safe ad-hoc querying through resource-scoped tool use. When the founder asks whether last week’s onboarding change moved activation rate, the agent discovers available datasets through MCP Resources. It selects the relevant governed Parquet file and queries it through DuckDB, isolated from the transactional instance. The server exposes only datasets authorized for the founder’s role, and each query logs identity, dataset, payload, and result status.
The Context Kubernetes paper formalizes a three-tier permission model in which agent authority is always a strict subset of human authority. An agent therefore cannot reach data the founder has not explicitly granted it access to. Permission alone, however, does not establish freshness. A reconciliation loop detects stale or deleted content so that the agent waits for a refresh or flags the gap. Ad-hoc querying can then use the same datasets as detection and delivery without creating another analytical path into production.
What the governed data layer needs from the Supabase project to work reliably
These patterns assume schema discipline, observability, and connection hygiene in the source project. Every schema change must go into a version-controlled migration. Changes made through the Supabase Table Editor UI skip migration history, so the analytical pipeline built on top has no audit trail to follow. That makes downstream failures harder to trace. A governed copy cannot compensate for an undocumented source schema.
Observability needs to be installed before the project scales. Postgres exporter, Realtime Prometheus metrics, and structured logging provide the foundation, supported by p50/p95 latency dashboards. pg_stat_statements identifies queries consuming the most total time, while slow query logging exposes regressions before user complaints become the signal. Connection and pool metrics reveal saturation before timeouts. Tracking the size of tables and indexes also shows growth before the need for partitioning comes as a surprise, so the founder has context for a change flagged by anomaly detection.
Connection hygiene starts with a single Postgres instance and connection pooling, with read replicas added when p95 query latency exceeds the threshold. Keeping analytical queries on the governed copy isolates them from the production latency that triggers read replicas, and this foundation requires setup work from the founder. The trade is between migration discipline and observability instrumentation established once, and the continuing overhead of ad-hoc querying and dashboard maintenance. Skipping the hire does not mean skipping the conditions that make reporting reliable.
Why governance — not orchestration sophistication — limits how far these patterns scale
Adding agents increases the demands on the data layer before it justifies more elaborate workflows. The same paper identifies five scaling problems, namely scheduling, permissions, health monitoring, state management, and auditability. Each requires control over the knowledge supplied to agents. More orchestration cannot repair an inconsistent metric definition. Nor can it make an unauthorized dataset safe to expose.
The paper’s tested attack scenarios also distinguish full governance from basic RBAC. Only the full governance architecture blocks all tested scenarios, while basic RBAC misses the attack addressed by the three-tier model. This makes permission design an architectural decision from the start. When a second team member or agent joins, the governed layer supplies shared metric definitions, preserving the meaning of ARR without a new reconciliation exercise.
Headless analytics is the natural endpoint of that separation. Data infrastructure decoupled from any single front end can serve an investor dashboard, a Slack bot, an AI coding agent’s context window, or a future hire’s BI tool through MCP or API. The original morning digest remains another consumer of the same layer. The durable replacement for the analytics hire’s operational work is therefore not a particular agent arrangement. It is trustworthy data that new humans and agents can use without rebuilding the reporting system.